
SmartFAQs Analytics
Access to SmartFAQs Analytics requires Super Admin or Admin permissions in the SearchBlox Admin Console. It can be accessed from the Analytics section of the SearchBlox Console.
SmartFAQs Analytics gives you a complete view of how your SmartFAQs are performing. It tracks user interactions across all your FAQs, shows category-wise distribution, and measures engagement patterns — helping you identify which FAQs are working and which need improvement. All reports support date-range filtering and one-click export.
SmartFAQs Analytics Reports
The Overview Report displays the total number of SmartFAQs in your system and categorizes them by status:
- Active — SmartFAQs currently visible on the search page.
- Inactive — SmartFAQs that have been disabled.
- Not on Search Page — SmartFAQs that exist but are not currently displayed in search results.
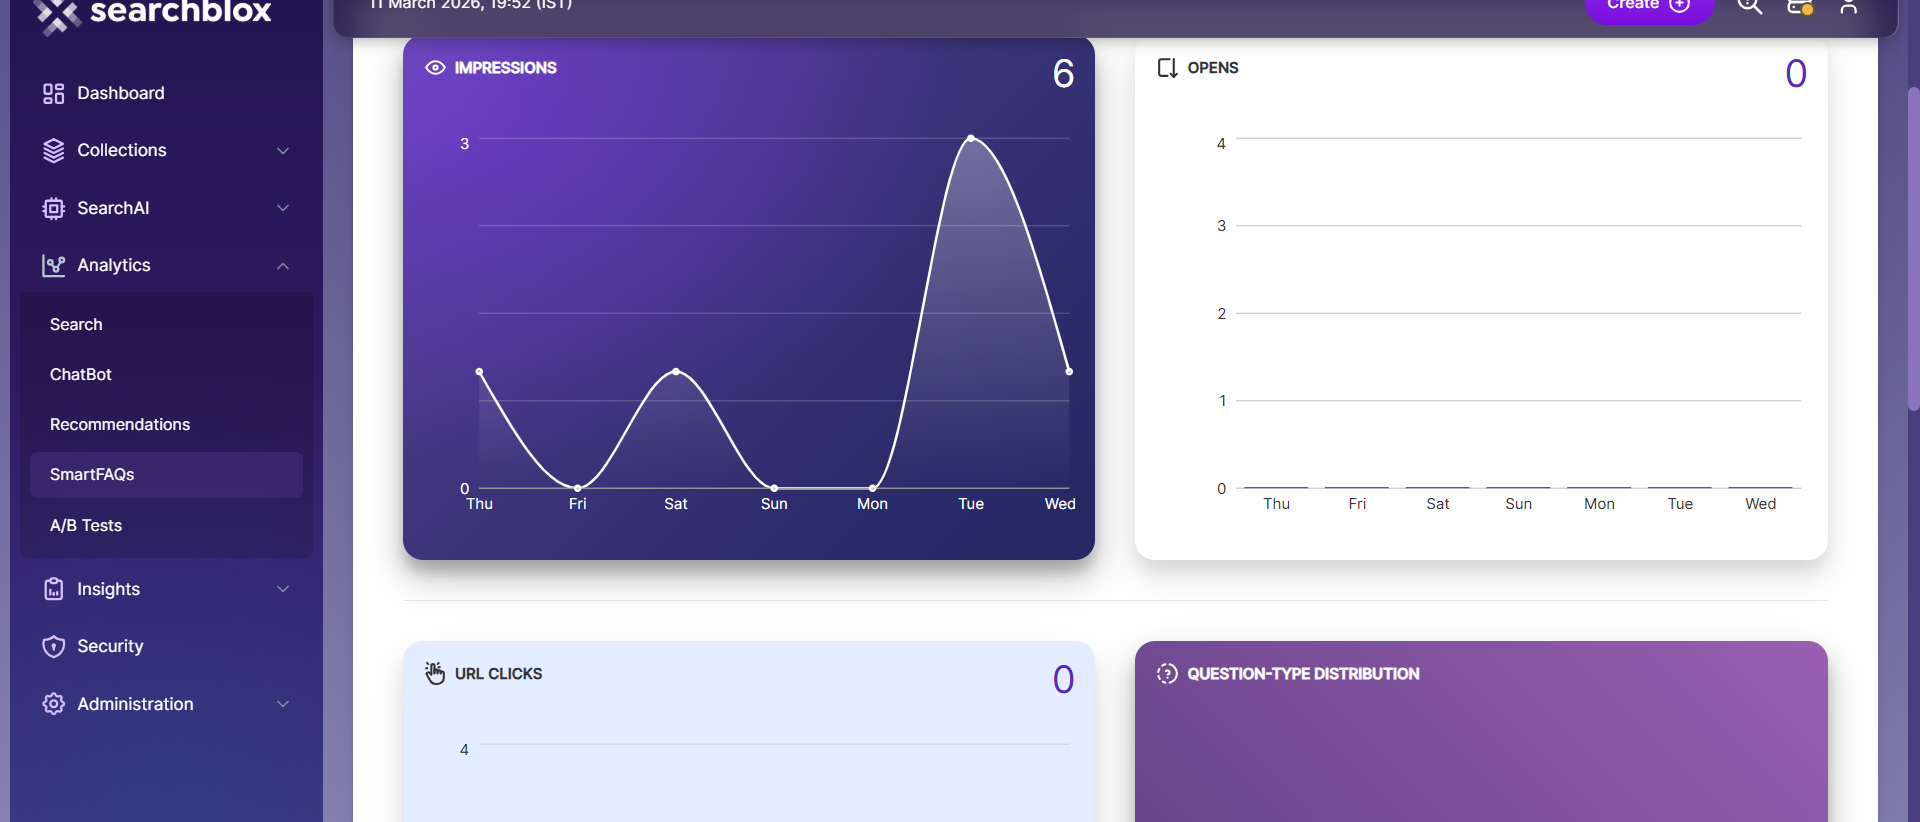
User interactions are tracked for each SmartFAQ and presented through graphical charts. Reports can also be filtered by individual collections or groups of collections.
| Metric | Description |
|---|---|
| Impressions | Number of times a SmartFAQ was displayed to users |
| Opens | Number of times a SmartFAQ was expanded or opened |
| Clicks | Number of times users clicked through from a SmartFAQ |
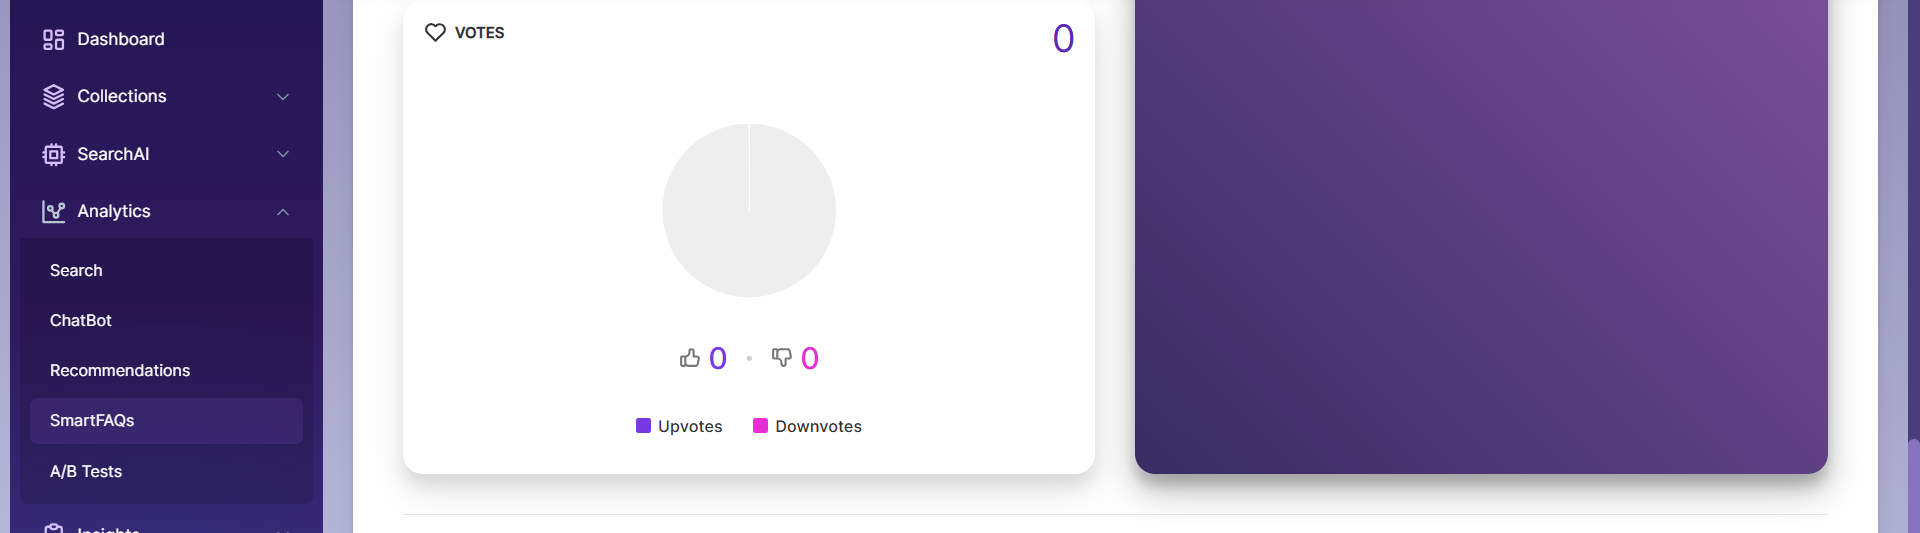
| Upvotes | Number of positive ratings received |
| Downvotes | Number of negative ratings received |

SmartFAQs User Engagement
For each SmartFAQ, a detailed user action report displays up to 5 SmartFAQ interactions per page. The complete report can also be exported based on the selected date range.

Download Query Logs Report
SmartFAQs Analytics enables you to compare results and download query logs for:
- Today
- Yesterday
- Past Week
- Past Month
- Past 3 Months
- Past 6 Months
- Last Year
The 'compare' button offers three analytical perspectives:
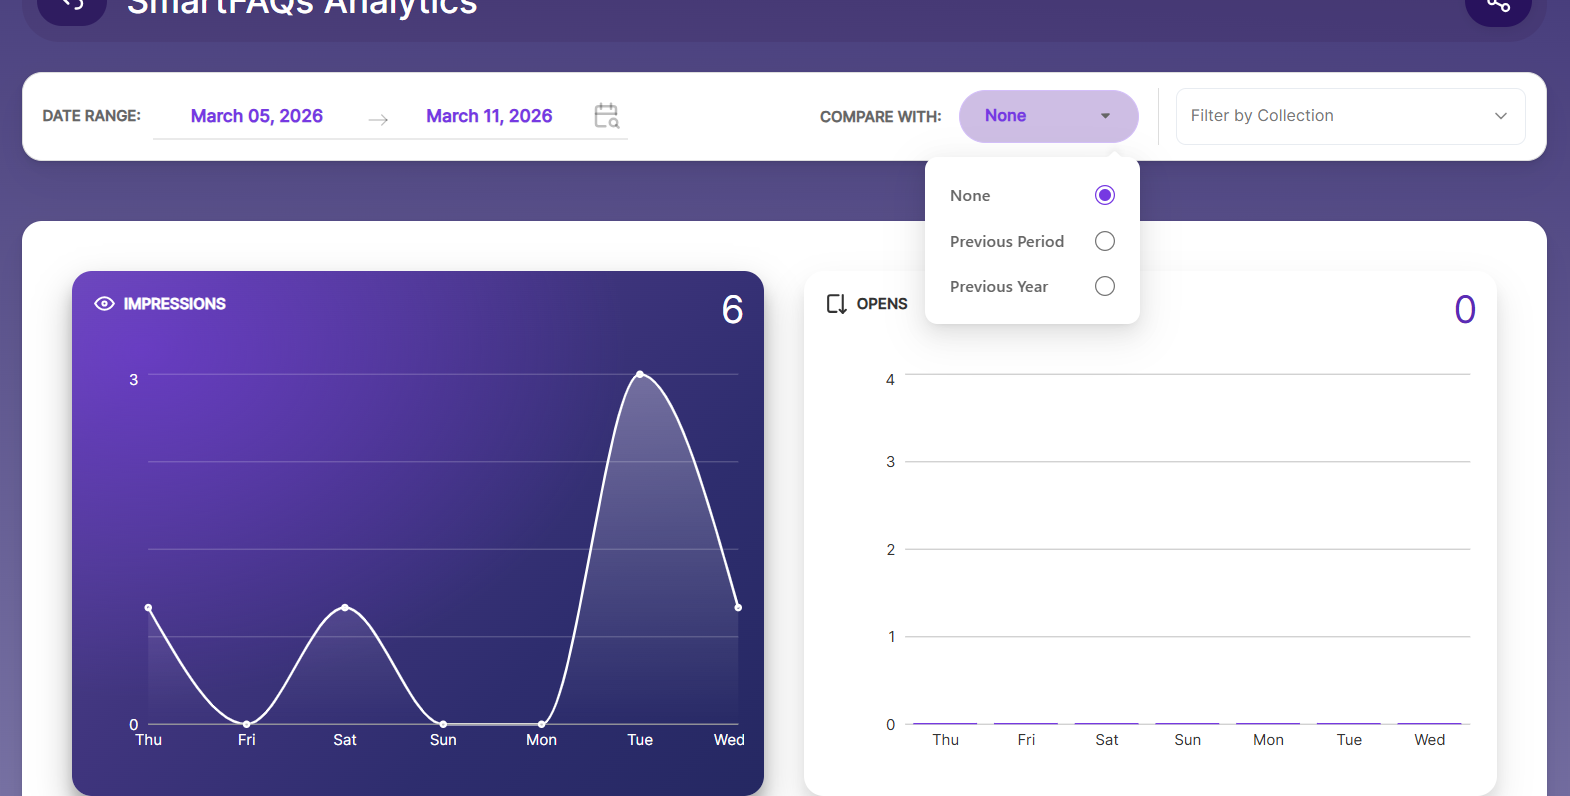
- None – Shows full results with no comparison.
- Previous Period – Compares results with the same days from the previous period.
- Previous Year – Compares results with the same date range from the previous year.
For deeper analysis, query logs can also be downloaded for any selected date range.

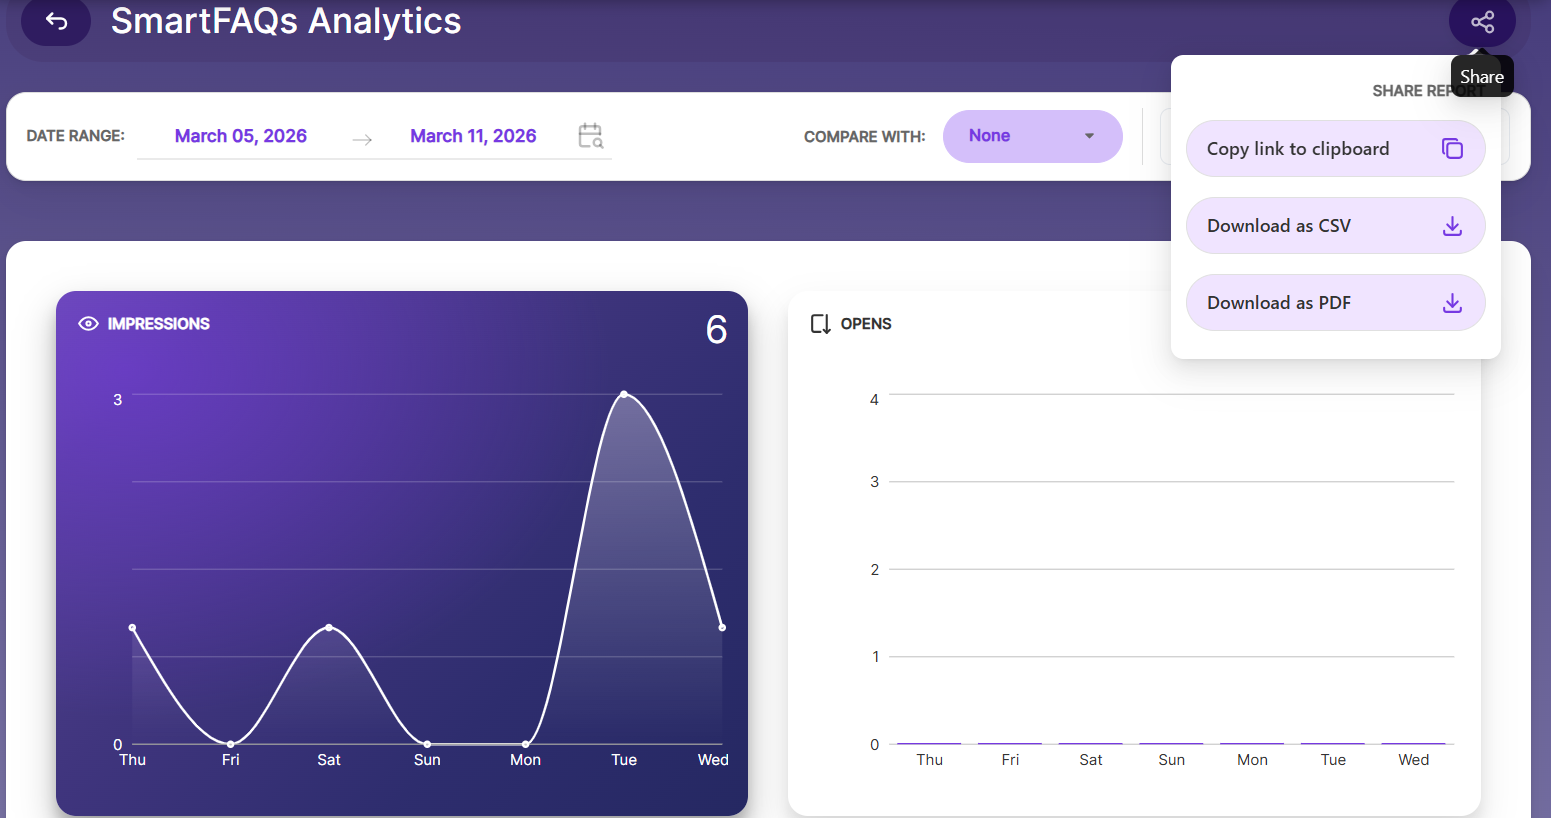
SearchBlox offers three convenient ways to share reports:
Copy link to clipboard- Copy and share the direct link with team members.
Download as CSV- Export reports in CSV format for data analysis.
Download as PDF- Export reports in PDF format for presentations or analysis.
Updated about 1 month ago