Kibana Visualizations
Kibana Analytics Integration with SearchBlox
Kibana Visualizations Simplified With SearchBlox
Prerequisites
SearchBlox 11.0+ running with OpenSearch 2.18
At least one collection with indexed data (documents, tweets, or web pages)
Admin access to the SearchBlox console
SearchBlox Kibana allows users to create, share, and embed visualizations and dashboards for any data type. It supports real-time data feeds from both external applications and SearchBlox, enabling live tracking of hashtags, keywords, and database transactions.
Key Features
- Real-Time Data Tracking – Monitor live data from external sources or SearchBlox.
- Interactive Visualizations – Analyze and visualize indexed data for insights.
- Dashboard Embedding – Easily share and embed dashboard
To learn more about Kibana, visit https://opendistro.github.io/for-elasticsearch-docs/docs/kibana/.
Step 1 – Start Kibana
Navigate to the Kibana binary directory:
Linux/macOS: /opt/searchblox/kibana/bin
Windows: C:\SearchBlox Server\kibana\bin
Execute the startup command:
Linux/macOS:
./kibana
Windows: Run kibana.bat
Step 2 – Access Kibana
Default Local Access
Open your web browser and navigate to:
http\://localhost:5601
To enable access via your network IP or domain:
Edit the Kibana configuration file:
../kibana/config/kibana.yml
Add or modify the host setting:
server.host: "0.0.0.0" # Listens on all network interfaces
Alternatively, specify your server's IP address:
server.host: "192.168.1.100" # Replace with your server's IP
Restart Kibana for changes to take effect.
Step 3 - Login to Kibana
Accessing Kibana
Open a browser and navigate to:
http://localhost:5601
Please give default Elasticsearch credentials,
Note: You can find the Elasticsearch login credentials in the searchblox.yml file, found in the following file path:
\SearchBloxServer\webapps\searchblox\WEB-INF\searchblox.yml
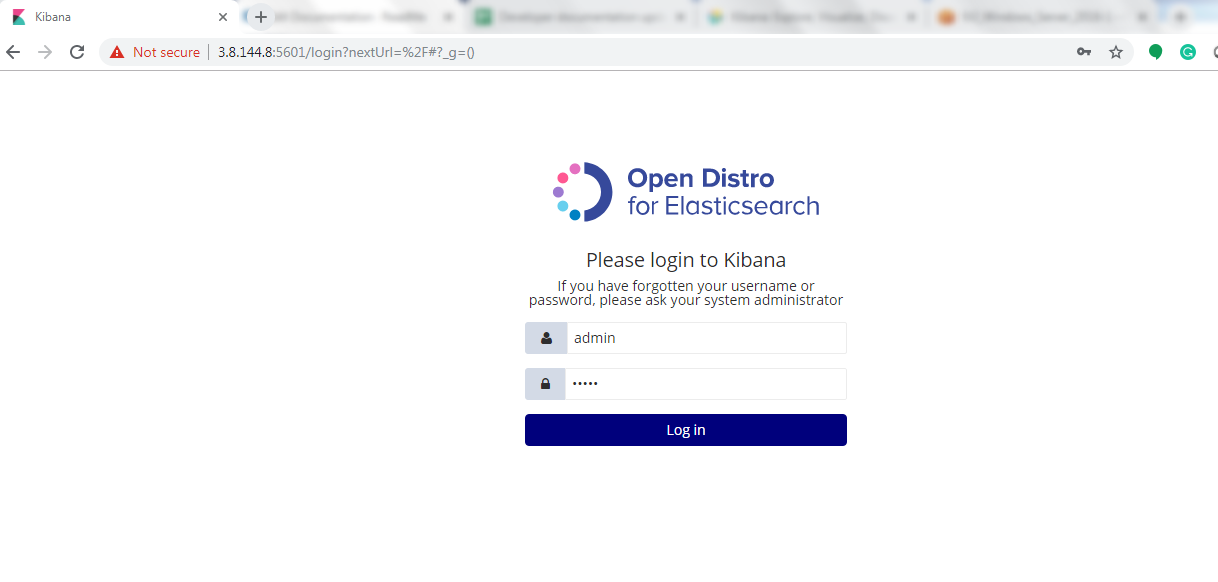
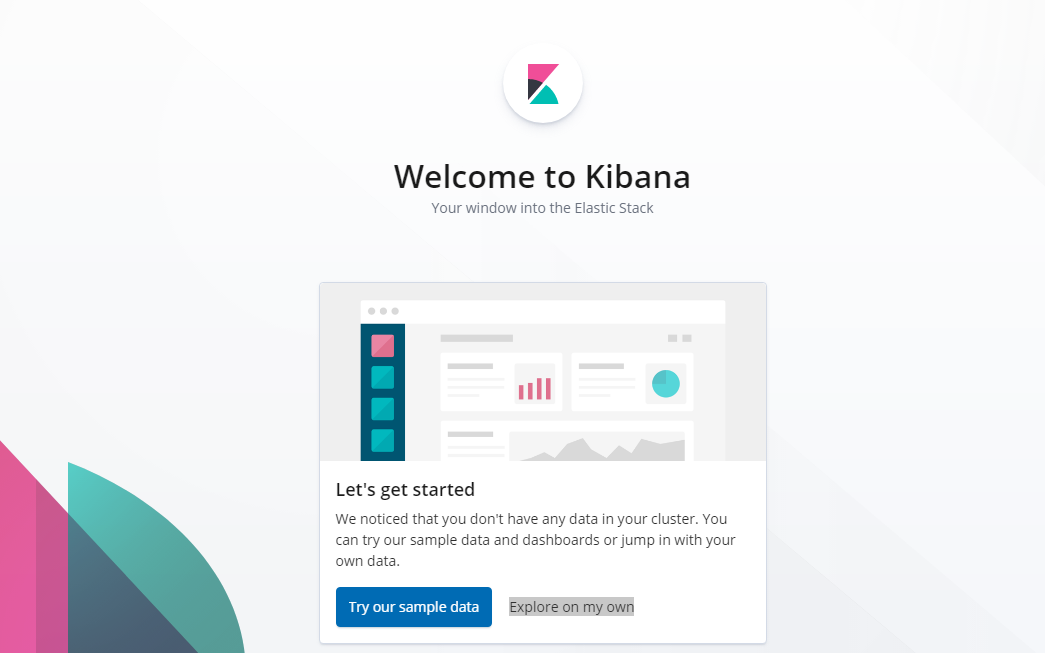
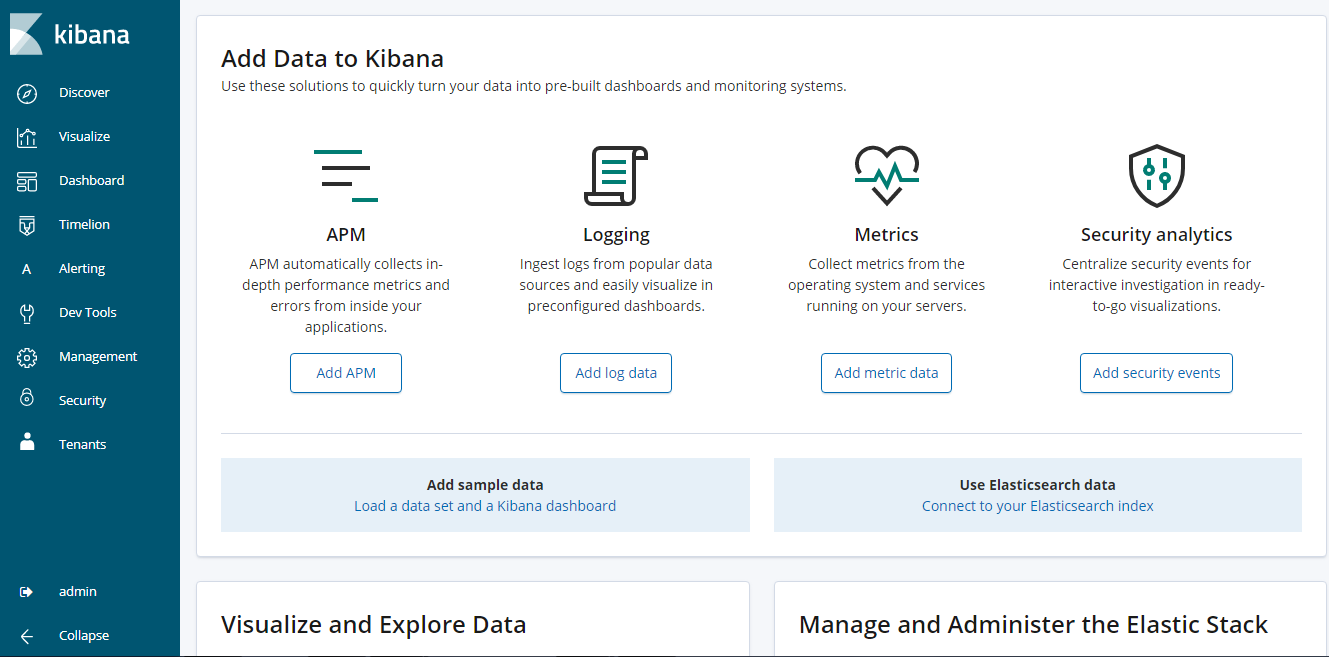
After logging in you would get the following page. Please click Explore on my own
Step 4 - Configure Index in Kibana
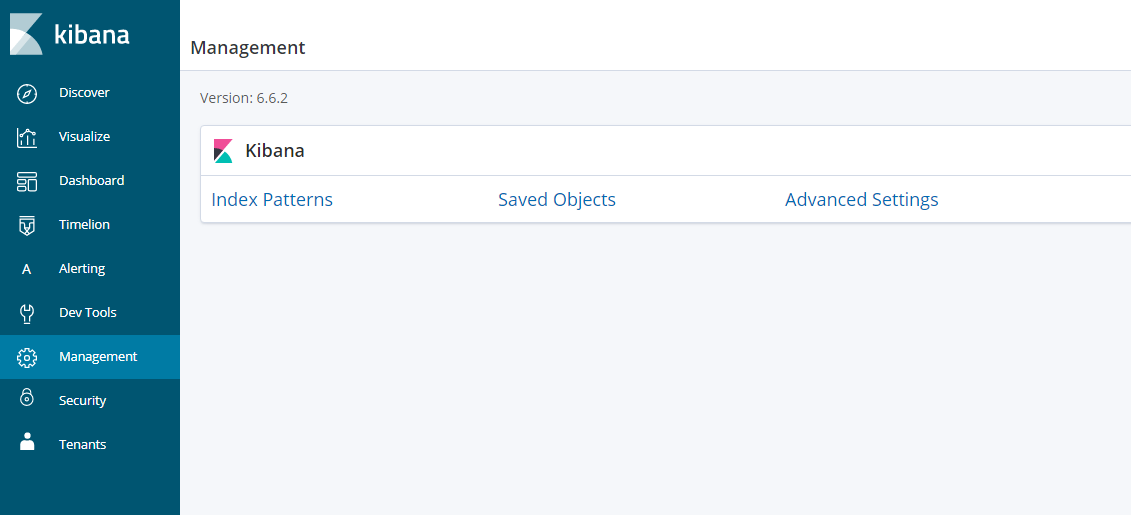
Access Index Management
- Navigate to Management in the left-hand menu
- Select Index Patterns
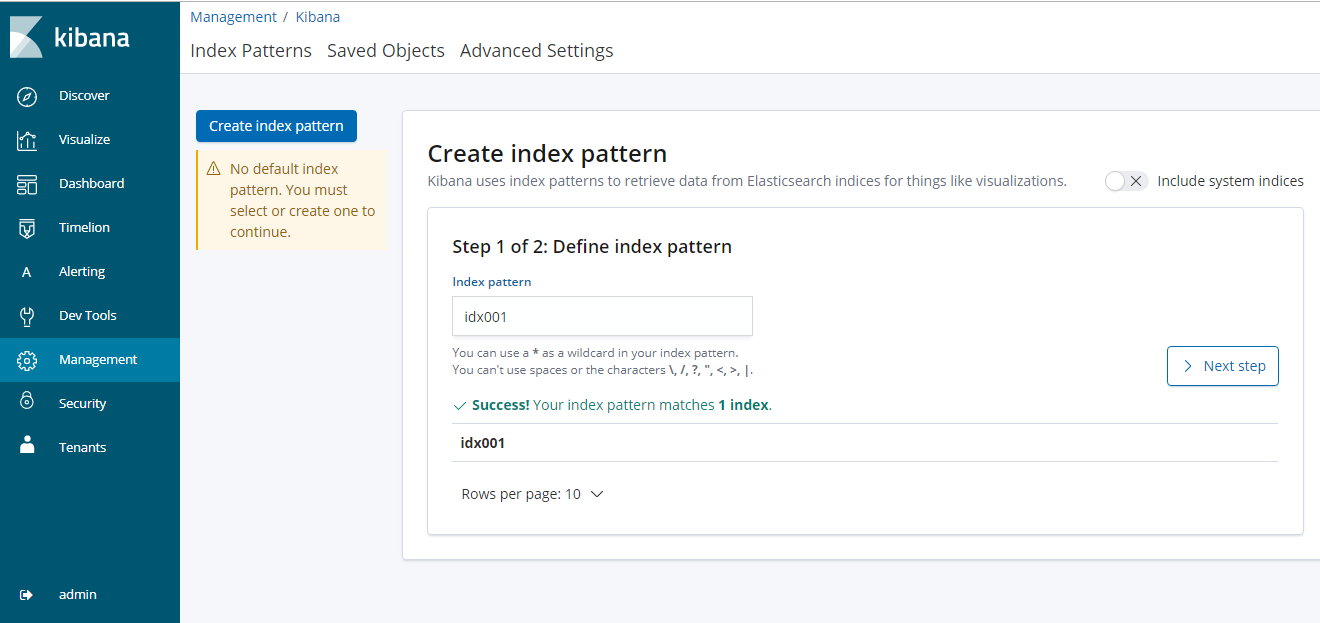
Create New Index Pattern
- Enter your Index ID (e.g., Collection ID 1 as idx001)
- Click Next Step
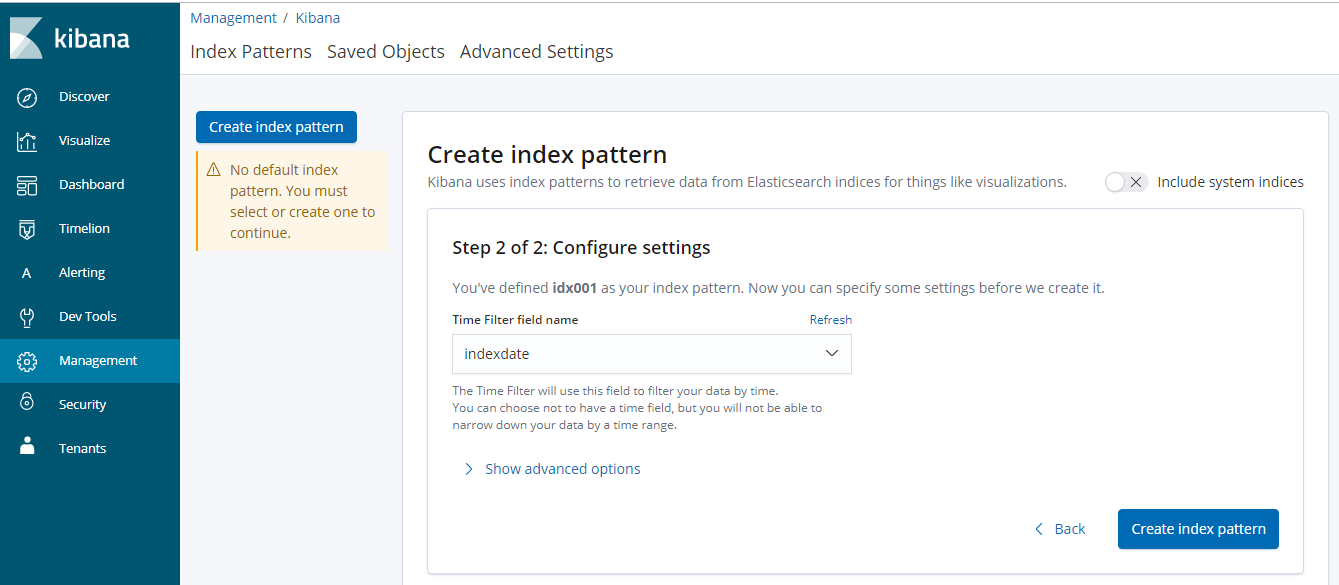
Set Time Filter Field
- Specify a time-based field (e.g., indexdate or lastmodified)
- Click Create index pattern
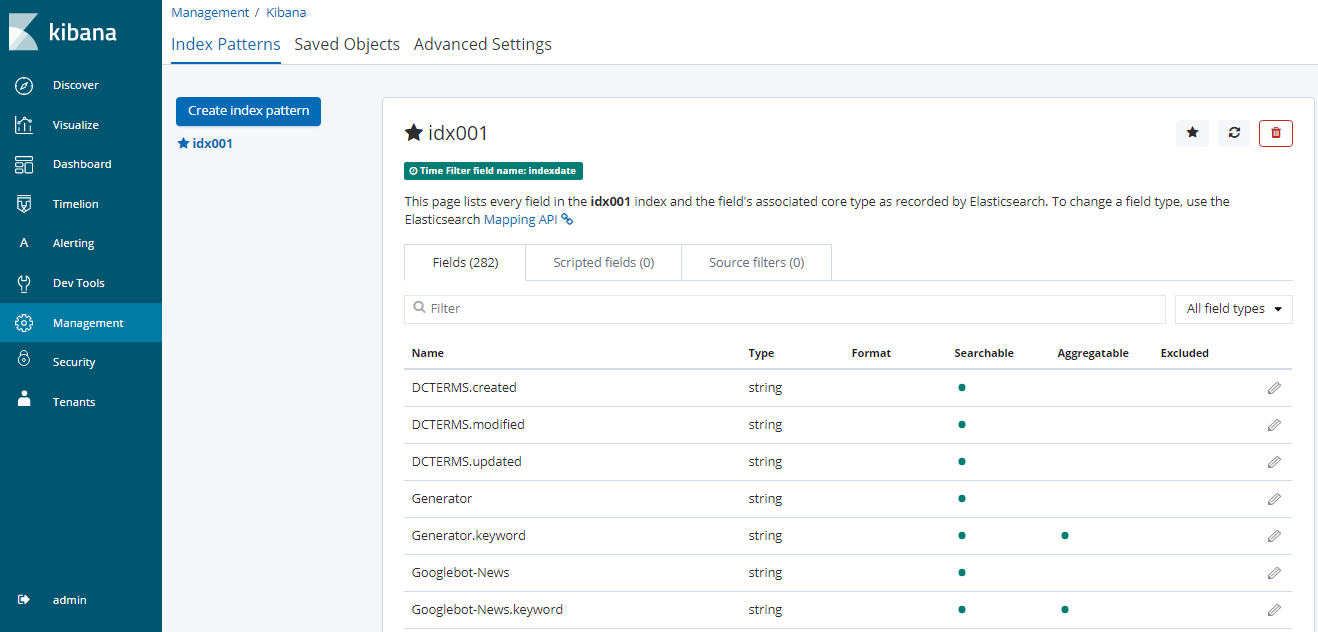
You would be able to view the index pattern with the fields as shown here
Step 3 – Create Visualization
In our documentation, we will show how to create few basic visualizations in Kibana
Access Visualization Tool
Select the Visualize tab from the menu
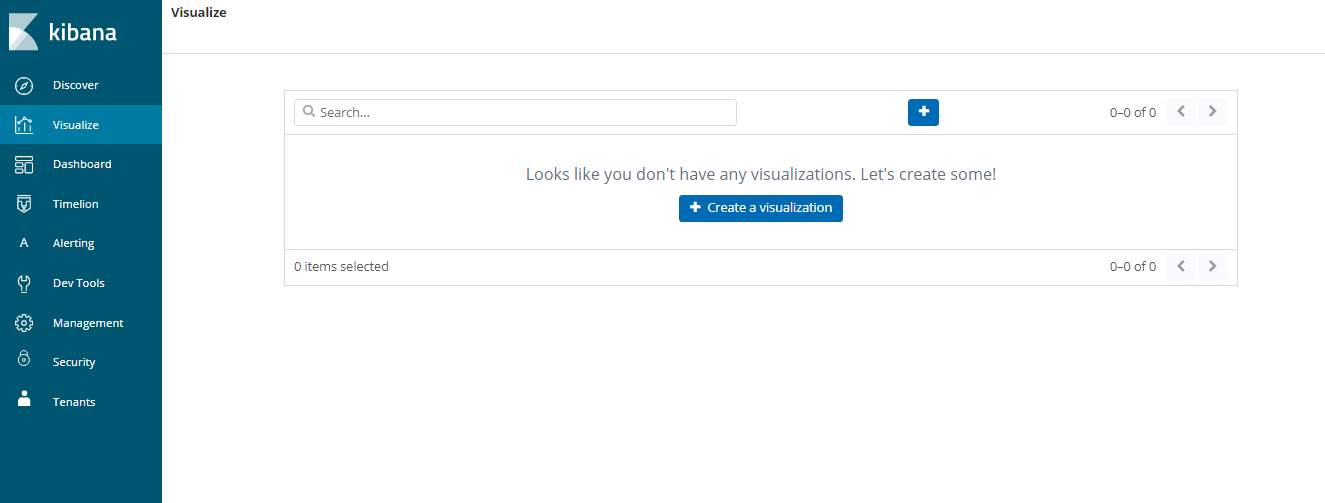
Click Create Visualization, you would be able to view the available visualizations
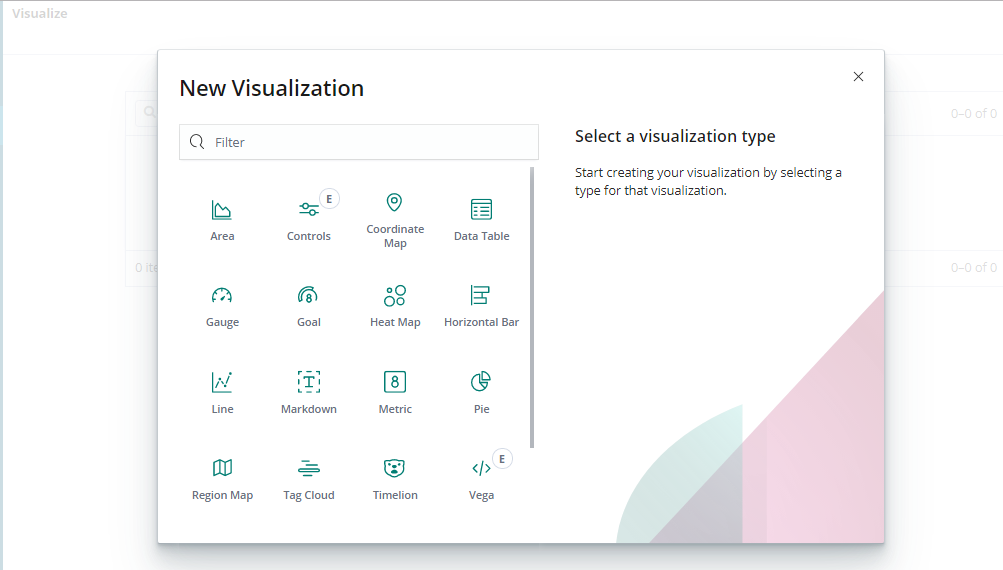
Choose Visualization Type
Select from available chart types (e.g., Pie Chart)
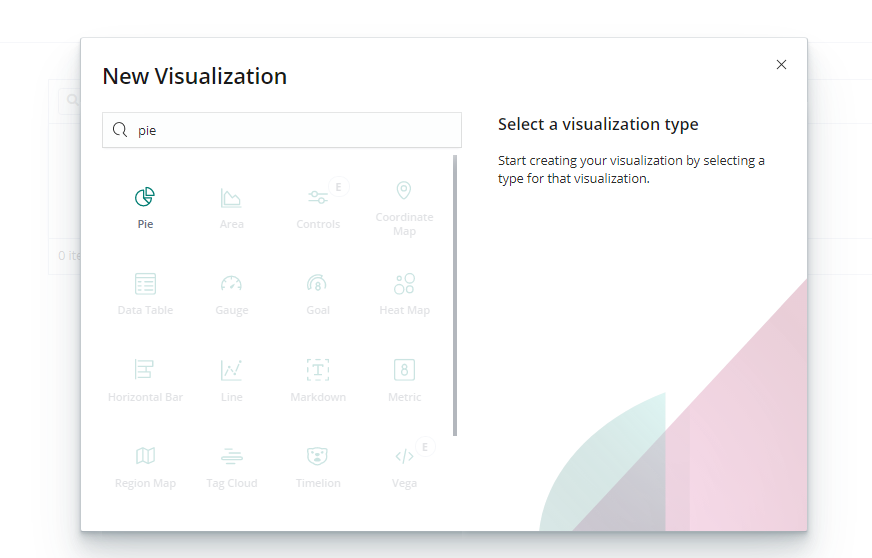
Step 4 – Visualize
After selecting the visualization, select the index.
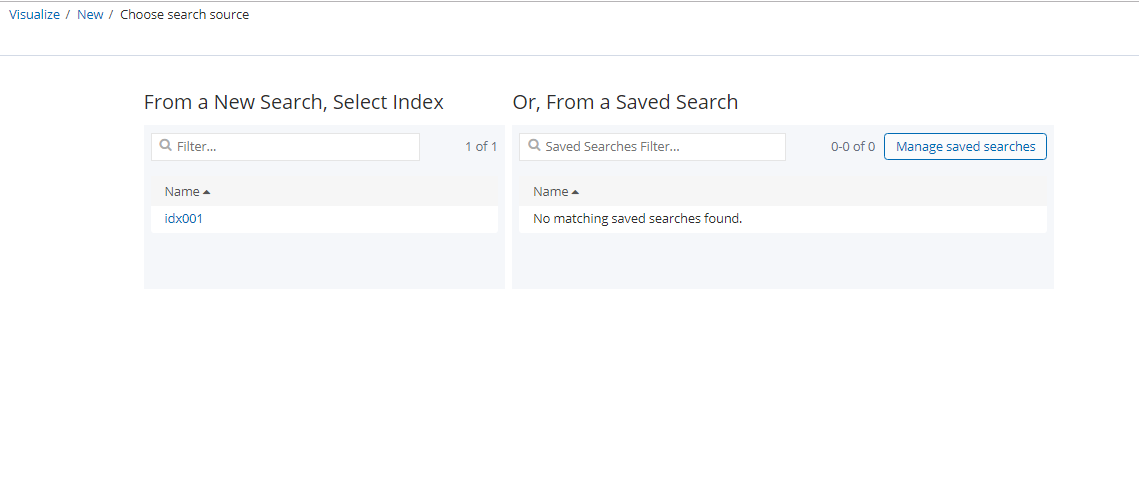
Configure Visualization
- Select your index pattern
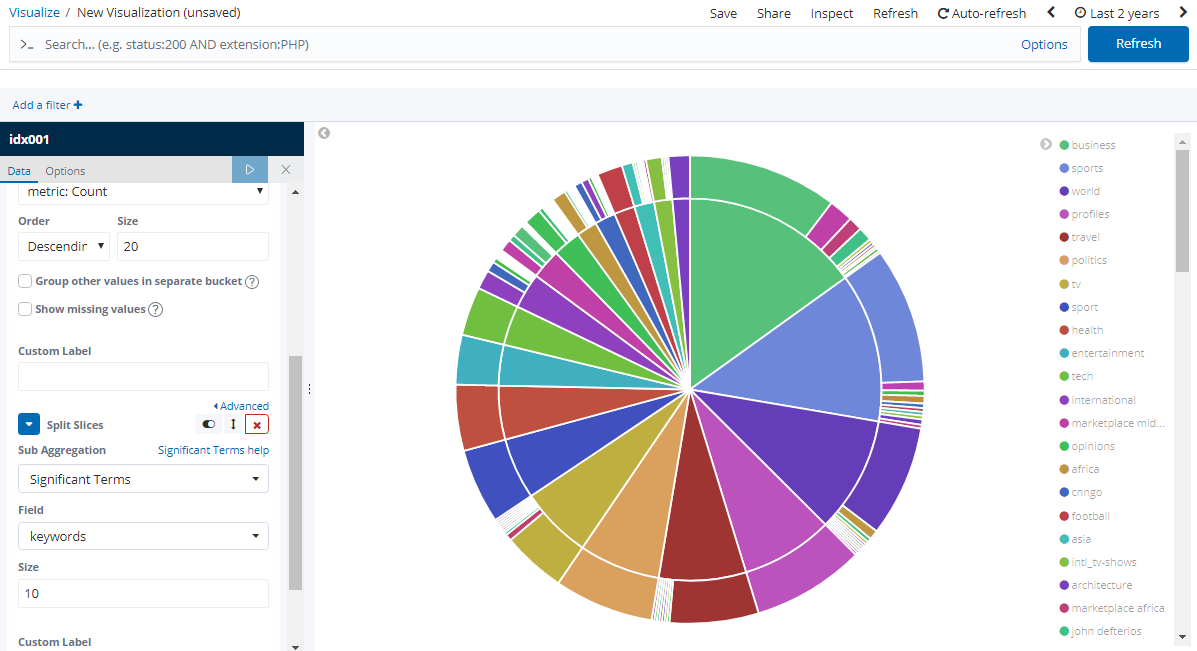
- Set aggregation type (e.g., "Terms") and field (e.g., "keywords")
- Click the play button to execute
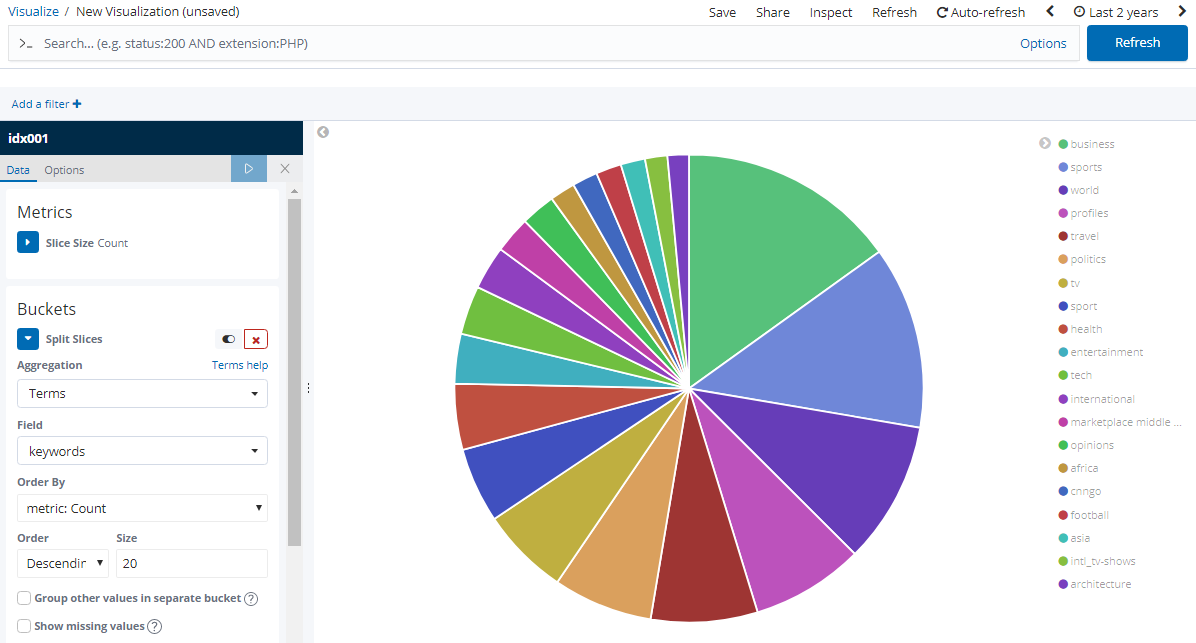
You can add subbuckets and generate visualization as shown here:
Selecting Time Range
Please make sure to select the time range in the top left corner of the page. Data will not be aggregated if the right time range is not selected as by default data from last 15 minutes will be the date range selected as shown here:
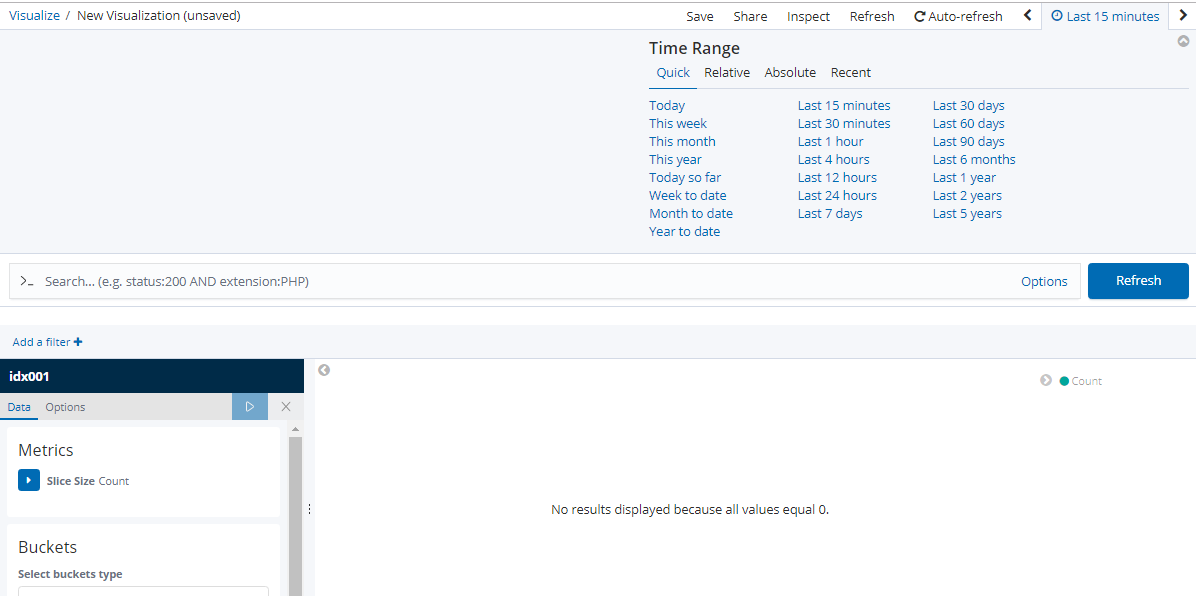
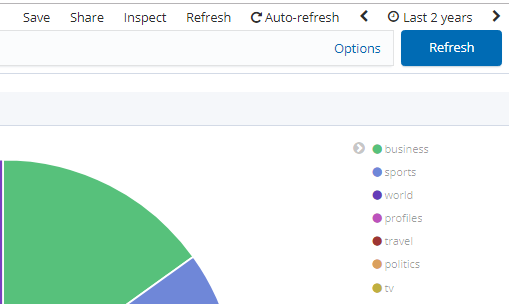
Explicitly select the date range in years or months based on your requirement
Dashboard
Save created visualizations via the save icon
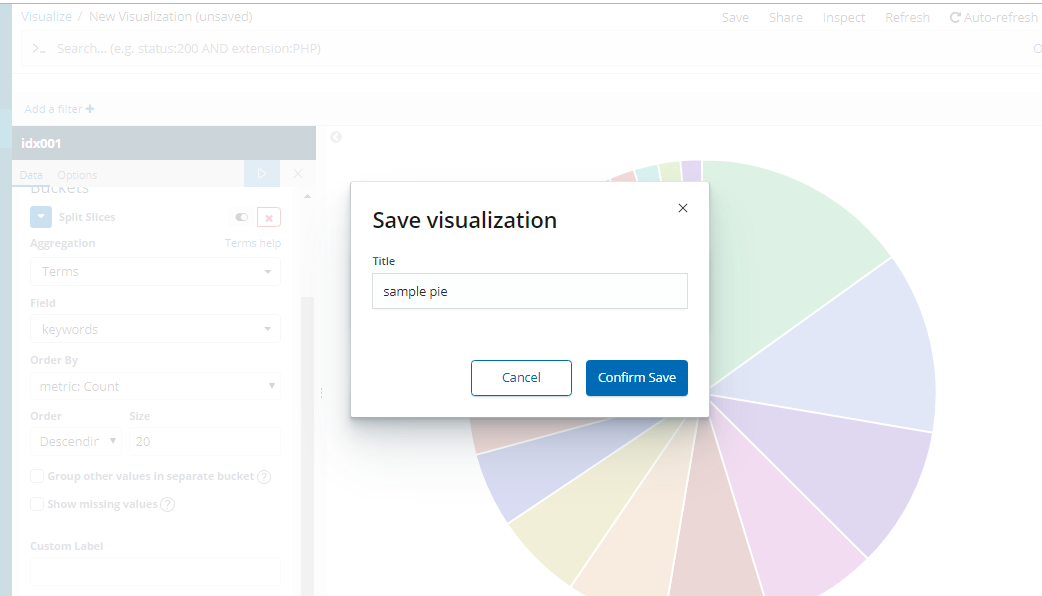
You can view the saved visualizations by clicking Visualization tab in menu
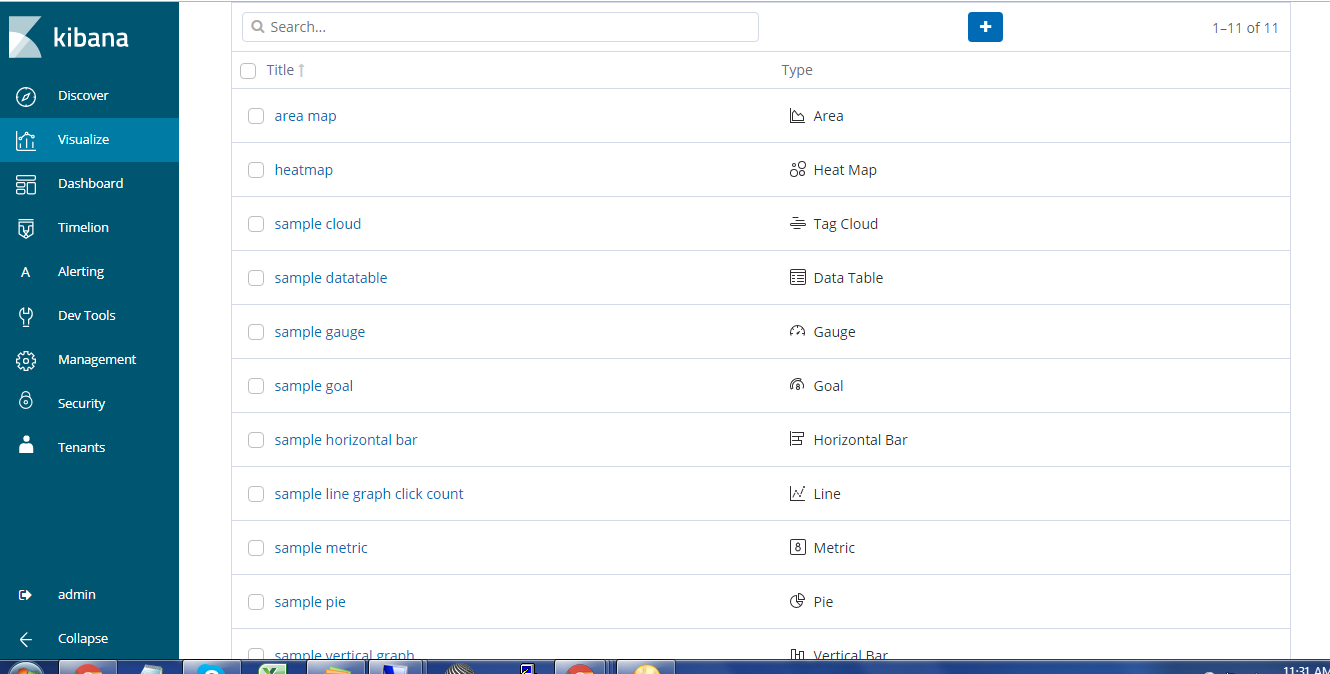
You can add these visualizations to dashboard
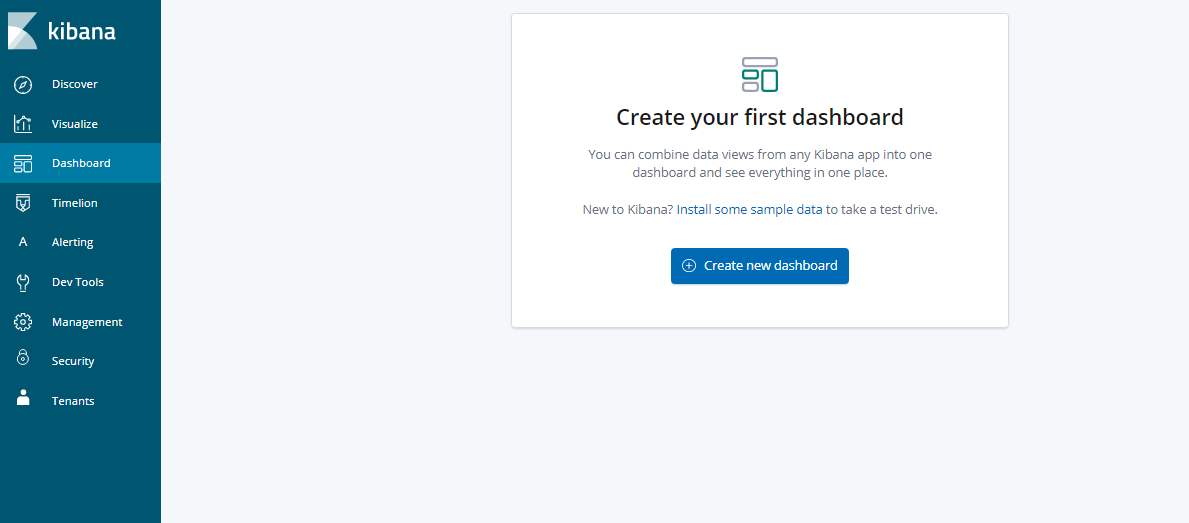
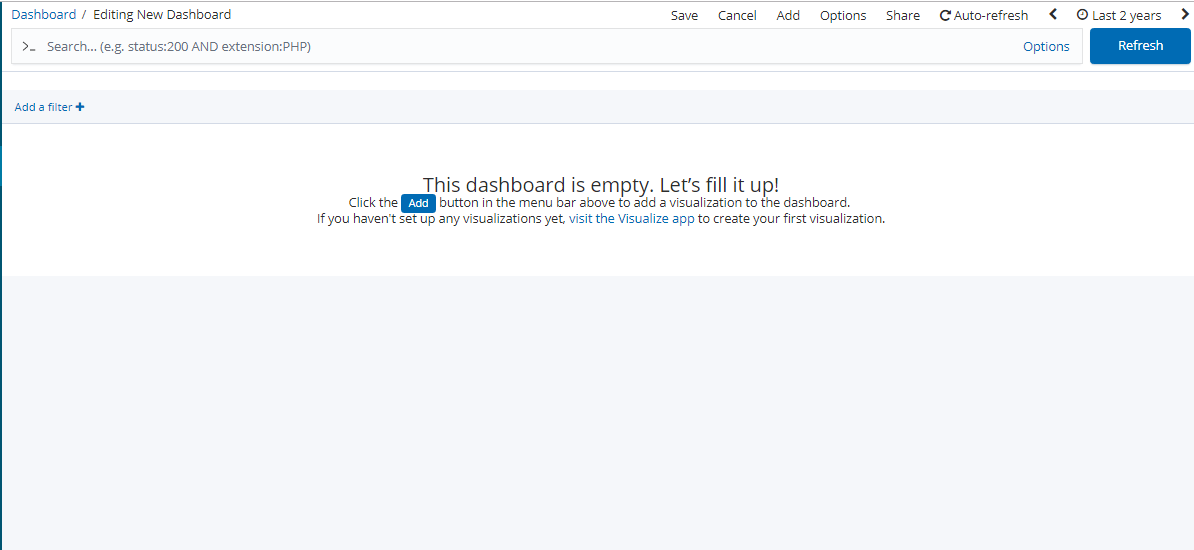
You can create multiple visualizations and add them to dashboard as shown here:

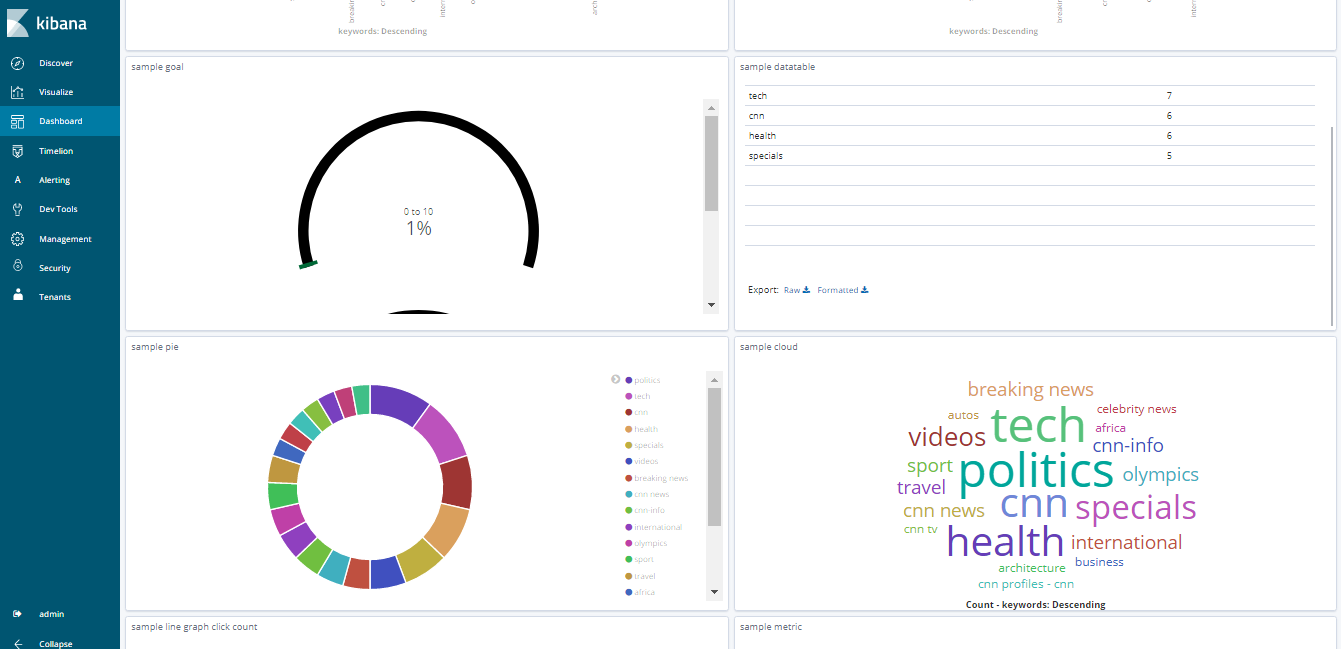
You can also save searches and display them along with visualisations in the dashboard as shown here.
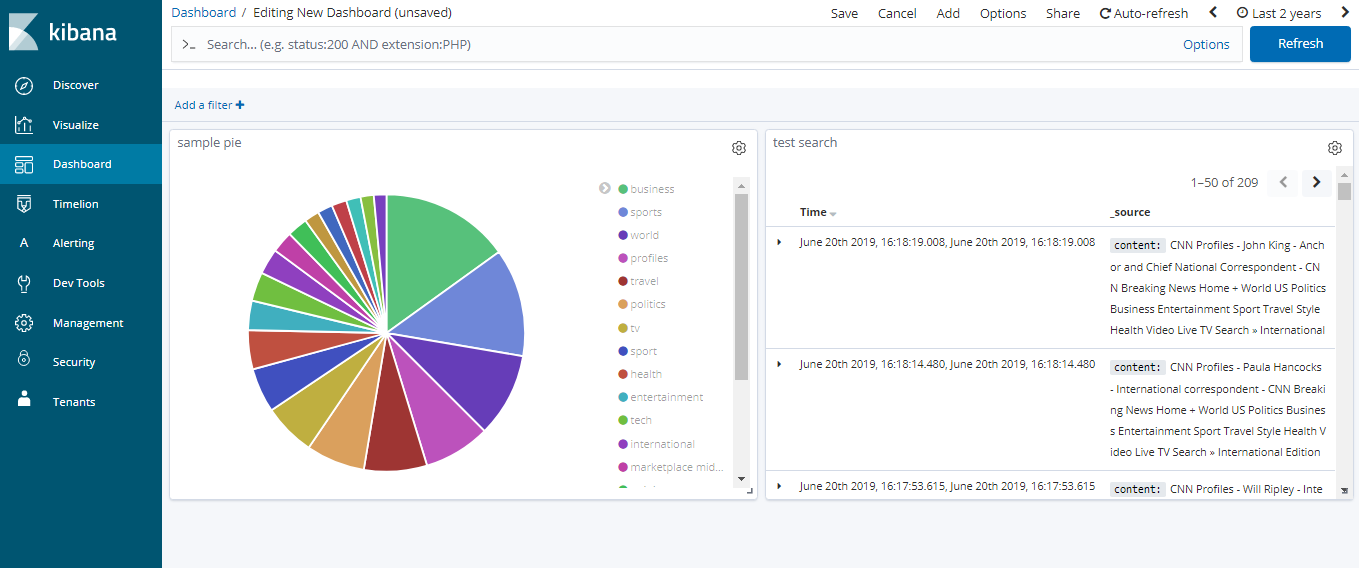
Searching from Kibana
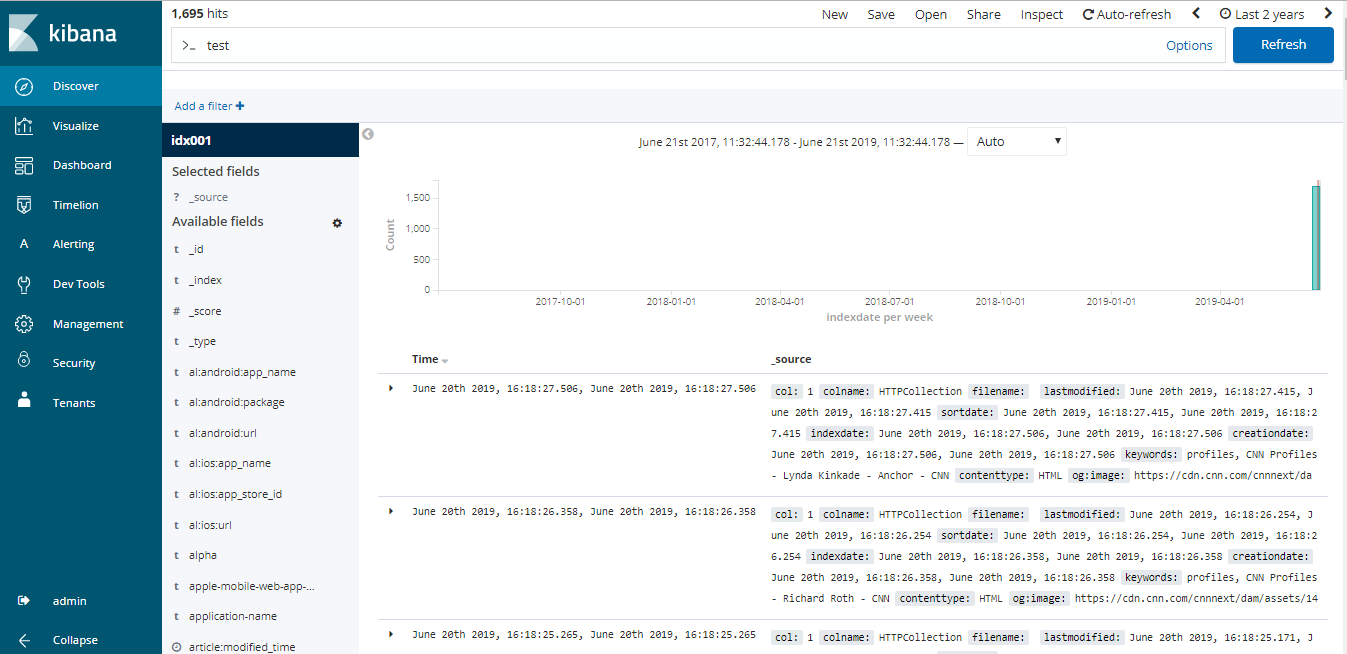
Using Discover Mode
- Navigate to Discover in the menu
- Perform searches across various fields and levels
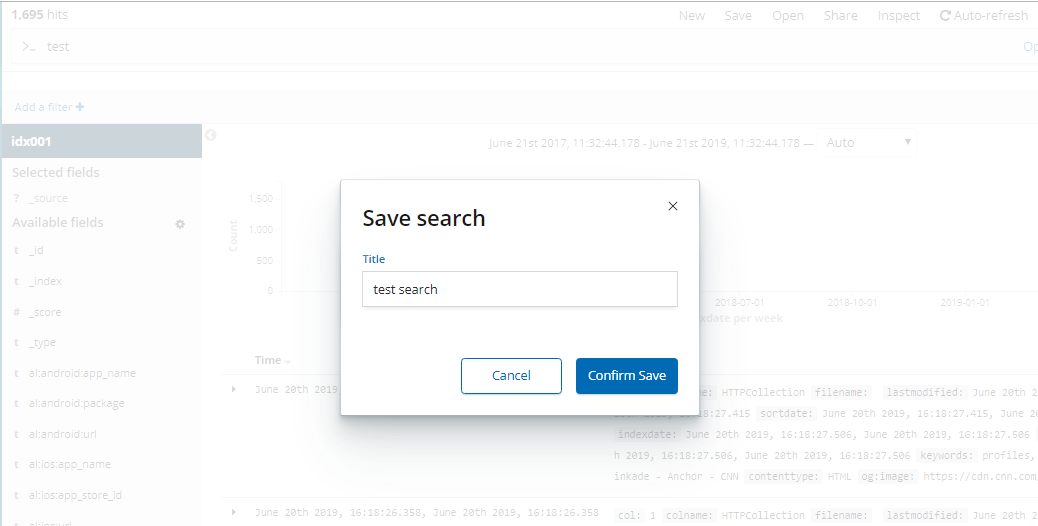
Saving Searches
Save useful searches for dashboard integration
Please note that you will be able to use Kibana only with a paid server license.
Updated 3 months ago
