
Overview
Your central control panel for managing search, content, users, and AI features across your organization.
Admin Console
The Admin Console is the central control panel for SearchBlox. From here, administrators can manage all collections, monitor search activity, configure AI features, control user access, and view system health.
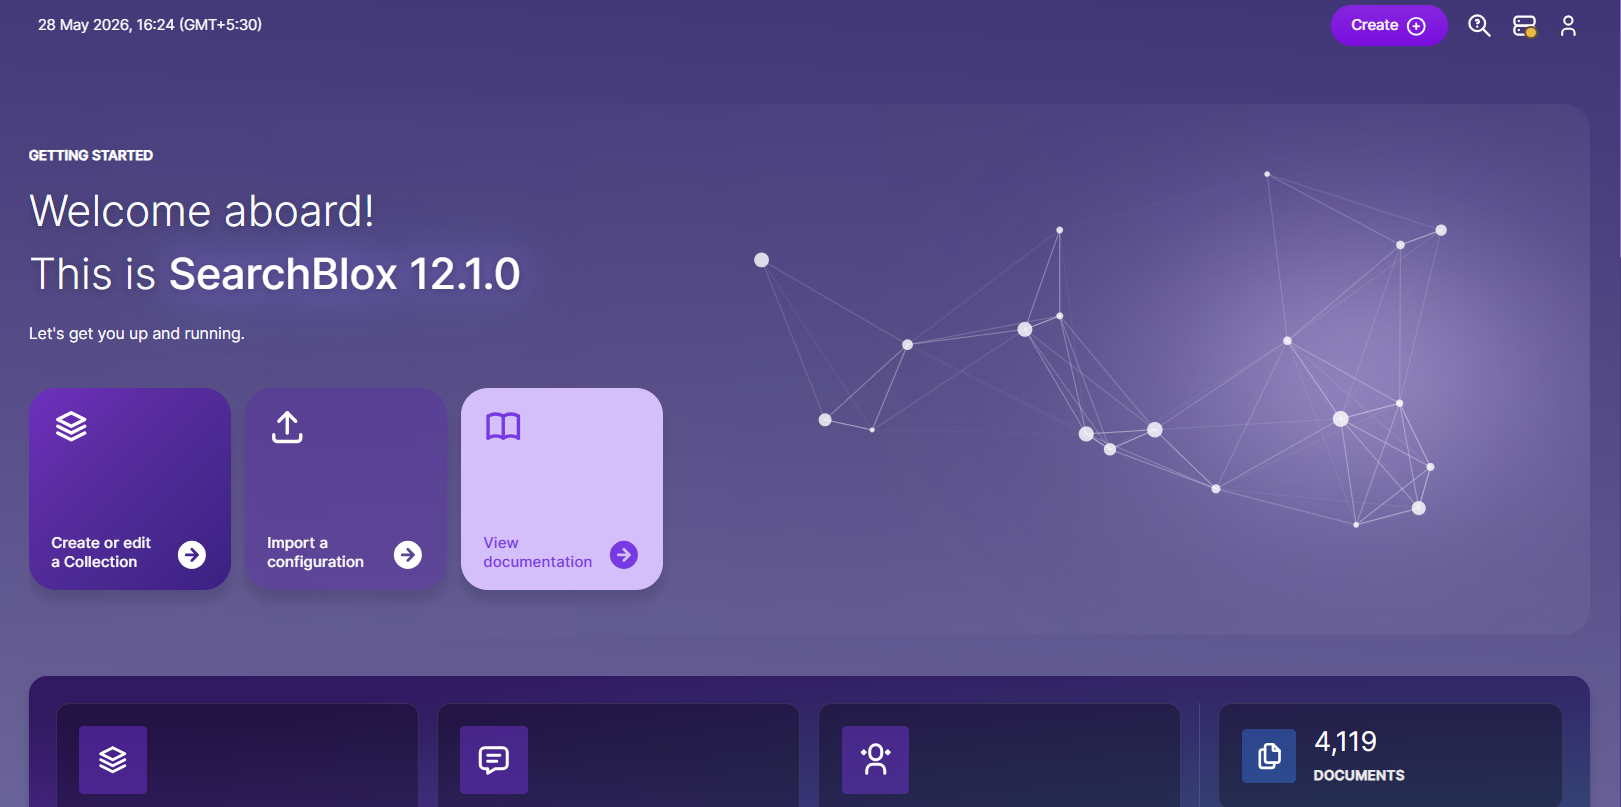
The Dashboard is the first screen you see after logging in. It gives you an instant snapshot of how your search platform is performing — showing active collections, indexed documents, chatbot usage, popular queries, and user engagement metrics, all in one place.
Accessing the Admin Console
Open your web browser and go to:
https://localhost:8443/console
Replace localhost:8443 with your actual server address or domain if you are not running SearchBlox locally.
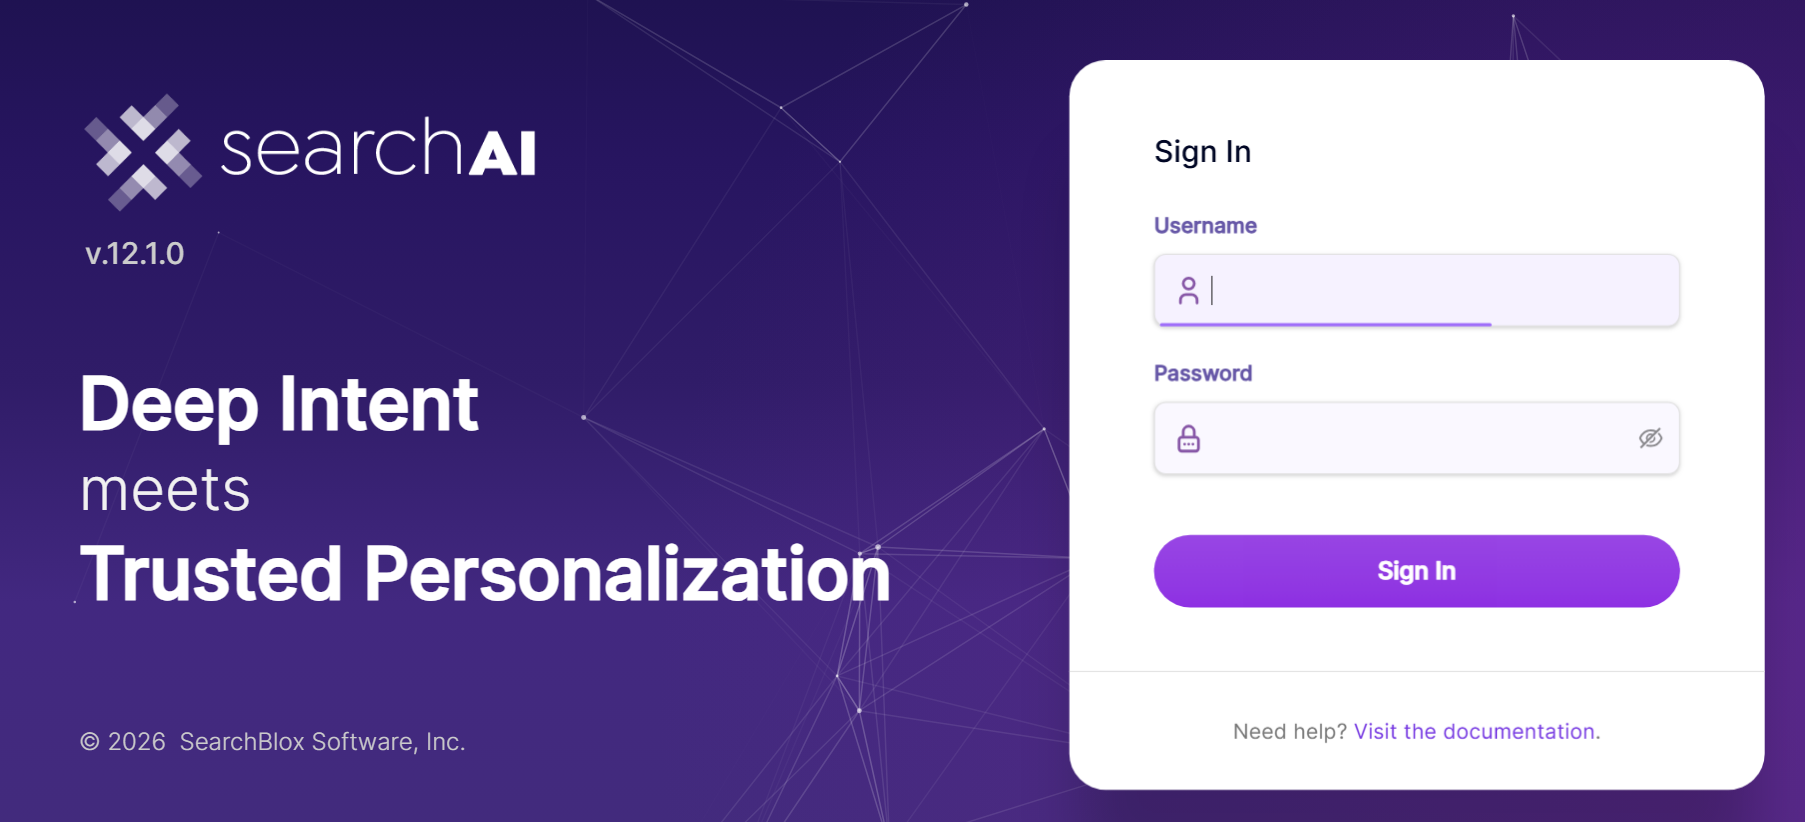
First-Time Login
When you open SearchBlox for the first time, a License Agreement will appear.
- Read the license agreement.
- Click I Agree.
- You will be redirected to the login page.
Who Can Access the Admin Console?
| Role | Access Level |
|---|---|
| Super Admin | Full access to all sections, including Security and Administration |
| Admin | Full access to all sections, including Security and Administration |
| Manager | Access to most sections, but cannot access Security or Administration |
Super Admin user, Admin users, and Manager users can access most areas of the Admin Console. The only restriction is that Manager users cannot access the Security or Administration sections, as these contain sensitive settings reserved for higher-level admins.
Welcome Screen
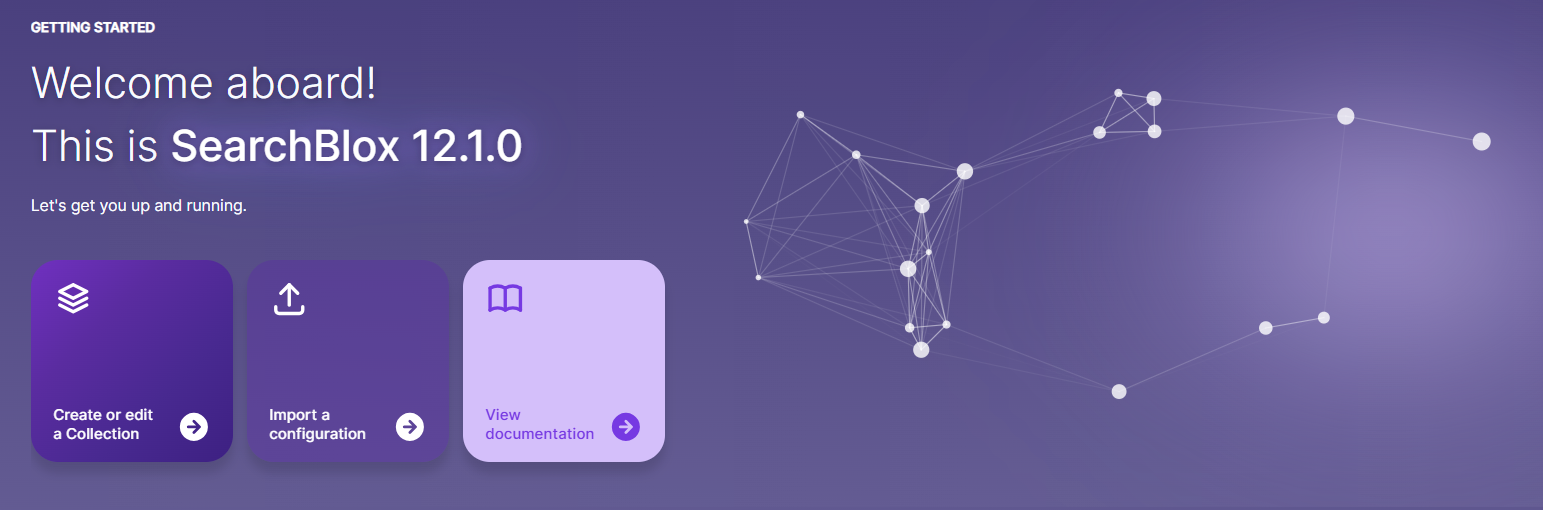
This section shows a Welcome message and highlights the most commonly used features of the product right after installation.
Create or Edit a Collection- This will redirect to the Manage Collection page.Import a Configuration- This will redirect to the Configuration page.View Documentation- This will redirect to the Documentation page.
Collections, Documents, and Chatbots
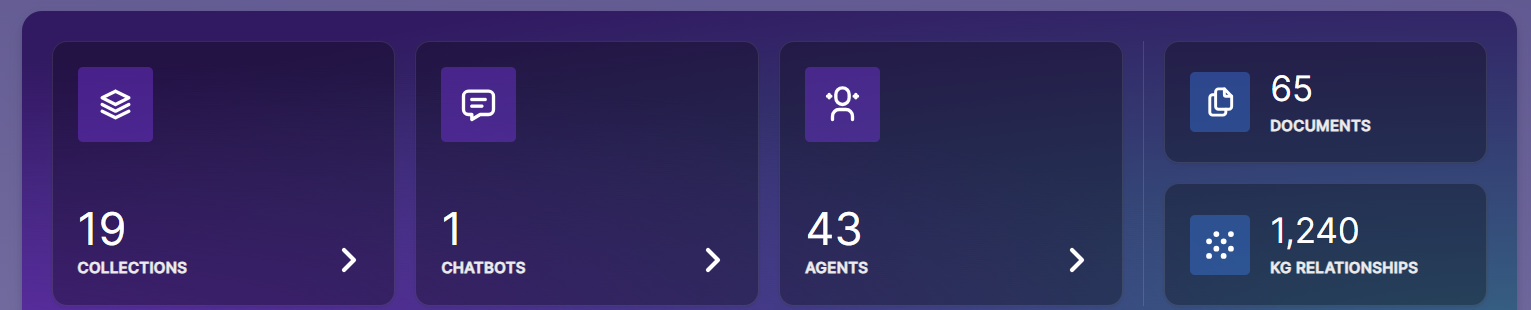
This section gives a quick overview of the system’s content and chatbot setup.
- Collections - Shows the number of collections (groups of indexed documents) in SearchBlox.
- Documents - Indicates the total number of documents indexed in the system.
- Chatbots - Displays the status of chatbots configured in the system.
- Agents - Shows the number of agents in SearchBlox.
- KG Relationships - Indicates the total number of KG relationships indexed across all collections in SearchBlox.
Activity Metrics Overview
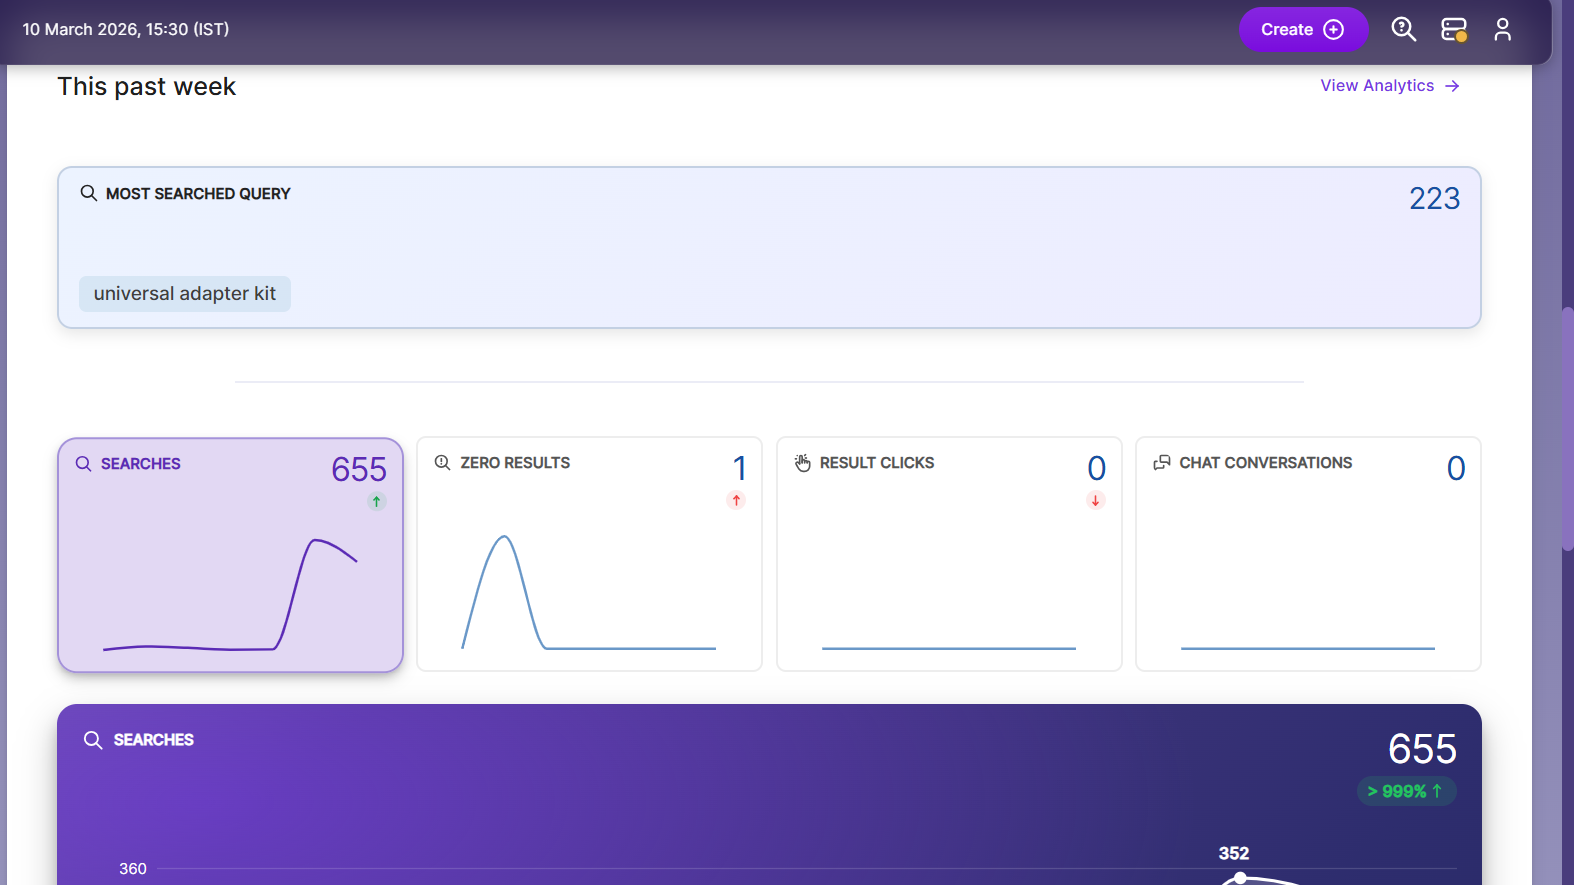
This section provides insights into user activity and engagement over the past week. These metrics help you understand how users interact with search and chat features, improve search relevance, and evaluate chatbot performance.
- Searches – Shows the total number of search queries submitted by users.
- Result Clicks – Indicates how many times users clicked on search results.
- Chat – Actions Engagement – Tracks how users interact with chatbot action buttons and available options.
- Conversations – Displays the total number of chatbot conversations started by users.
- Most Searched – Highlights the most frequently searched keyword along with the number of times it was searched.
Header
The left side of the header shows the current date and time, helping you track when actions happen and match them with events like scheduled tasks.
The right side of the header has dropdown menus and quick-access options:
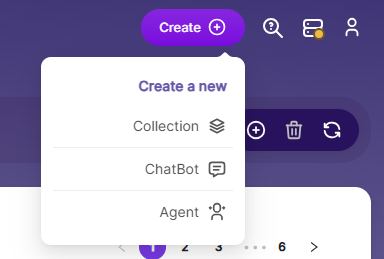
Create – A dropdown menu for creating new items:
Collection – Create a new collection to organize and index documents.
ChatBot – Create a new chatbot to assist users.
Agent – Create a new agent to perform tasks and automate workflows.
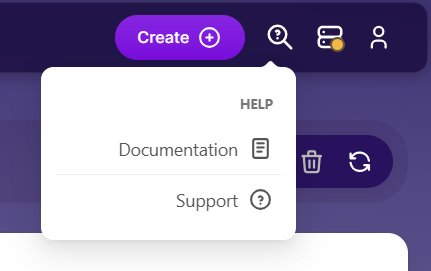
- Help - Provides quick access to useful resources:
- View user guides and technical documentation.
- Access support options for help with the platform.
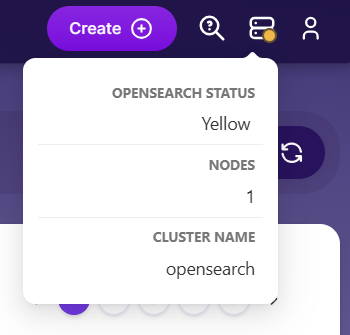
- OpenSearch Status
- Status – Shows the current health of the OpenSearch cluster:
- Green – All primary shards and their replicas are assigned to nodes.
- Yellow – All primary shards are assigned, but some replicas are missing.
- Red – One or more primary shards are not assigned to any node.
- Nodes – Displays the total number of nodes in the cluster.
- Cluster Name – Shows the configured name of the OpenSearch cluster.
- Status – Shows the current health of the OpenSearch cluster:
-
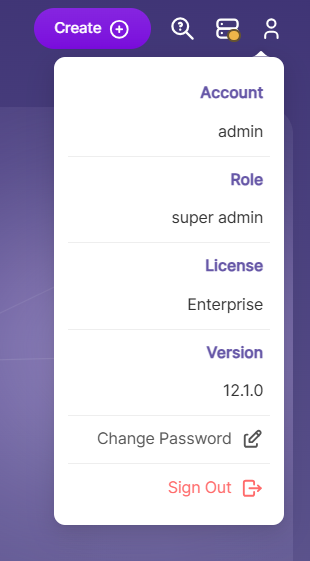
User Account Management
- Shows details about your account, role, license, and version.
- And let you Change Password or Sign Out from the platform.
Updated 18 days ago