
Zabbix
Installing Zabbix Agent
This section walks you through installing and configuring the Zabbix Agent on CentOS and RHEL-based Linux systems so that SearchBlox can be monitored through the Zabbix monitoring platform. The Zabbix Agent runs on the SearchBlox server and sends performance and availability data back to the Zabbix Server for tracking and alerting. Follow the steps below in order to complete the installation and configuration.
Step 1 – Add Required Repository
Configure the Zabbix yum repository using the following commands:
Centos 7
# Add Zabbix 4.0 LTS repository
sudo rpm -ivh https://repo.zabbix.com/zabbix/4.0/rhel/7/x86_64/zabbix-release-4.0-1.el7.noarch.rpm
Ubuntu 18.04
# Add Zabbix 3.2 repository
wget http://repo.zabbix.com/zabbix/3.2/ubuntu/pool/main/z/zabbix-release/zabbix-release_3.2-1+xenial_all.deb
sudo dpkg -i zabbix-release_3.2-1+xenial_all.deb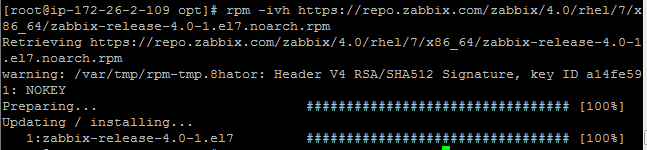
Step 2 – Install Zabbix Agent
Centos7
yum install -y zabbix-agentUbuntu
apt-get install zabbix-agent -y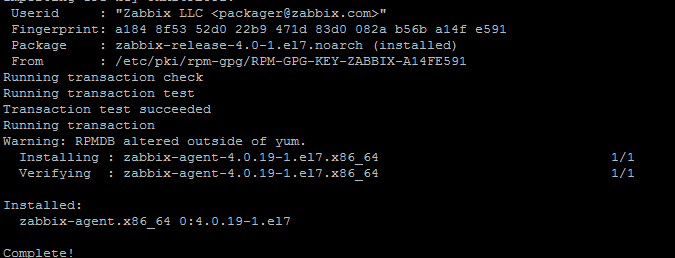
Step 3 – Edit Zabbix Agent Configuration
Configure zabbix agent by adding zabbix server IP in its configuration file/etc/zabbix/zabbix agentd.conf
vi /etc/zabbix/zabbix_agentd.conf_
#Server=[zabbix server ip]
#Hostname=[ Hostname of client system ]
Server=104.131.113.198
Hostname=Zabbix Server
Step 4 – Restarting Zabbix Agent
Restart agent service using the following commands.
systemctl enable zabbix-agent
systemctl start Zabbix-agent

To start and stop zabbix-agent service anytime, use the following commands.
systemctl start zabbix-agent
systemctl stop zabbix-agent
Port#10050 should be allowed in your Firewall (iptables, firewalld)
Adding JMX Monitoring to Zabbix
Step 1 – Enable jmx in jetty configuration
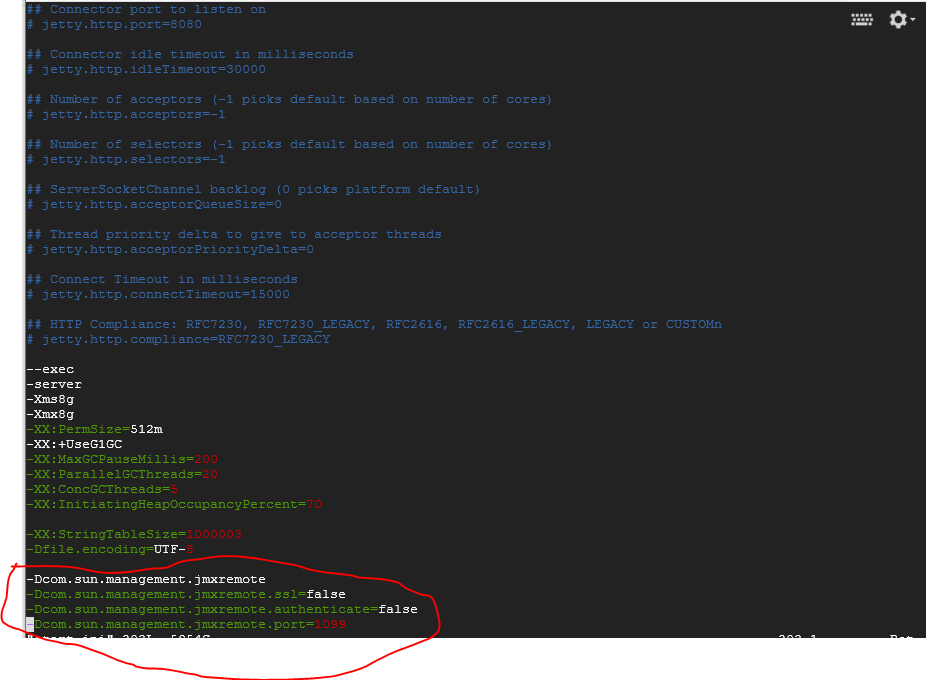
Open start.ini in searchblox directory (Eg: /opt/searchblox )
In line 48
-Dcom.sun.management.jmxremote
    -Dcom.sun.management.jmxremote.ssl=false
    -Dcom.sun.management.jmxremote.authenticate=false
    -Dcom.sun.management.jmxremote.port=1099
Then restart the SearchBlox service: # service searchblox restart
Confirm that it is listening using netstat –nutlp
netstat -nutpl | grep 1099
tcp6       0      0 :::1099                 :::*                    LISTEN      10419/java
Step 2 – Adding JMX monitoring in Zabbix
In Zabbix, go to Configuration -> Hosts

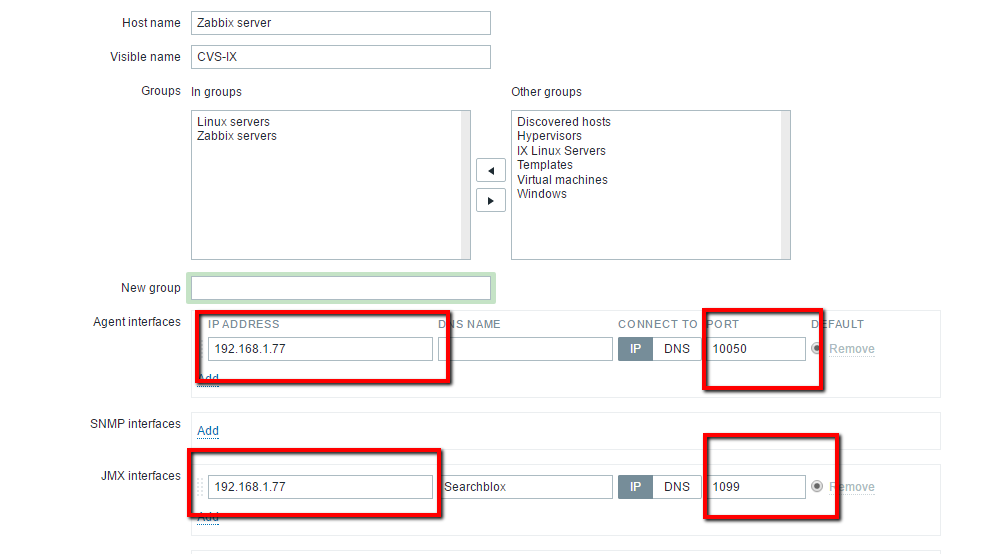
Adding the host into zabbix server
- Hostname:
- Visible Name: <give some name(optional) >
- Groups : <Template/Application>
- Agent Interface : and Port no is 10050
- JMX insterface : and port no 1099
- And click add to complete the host creation
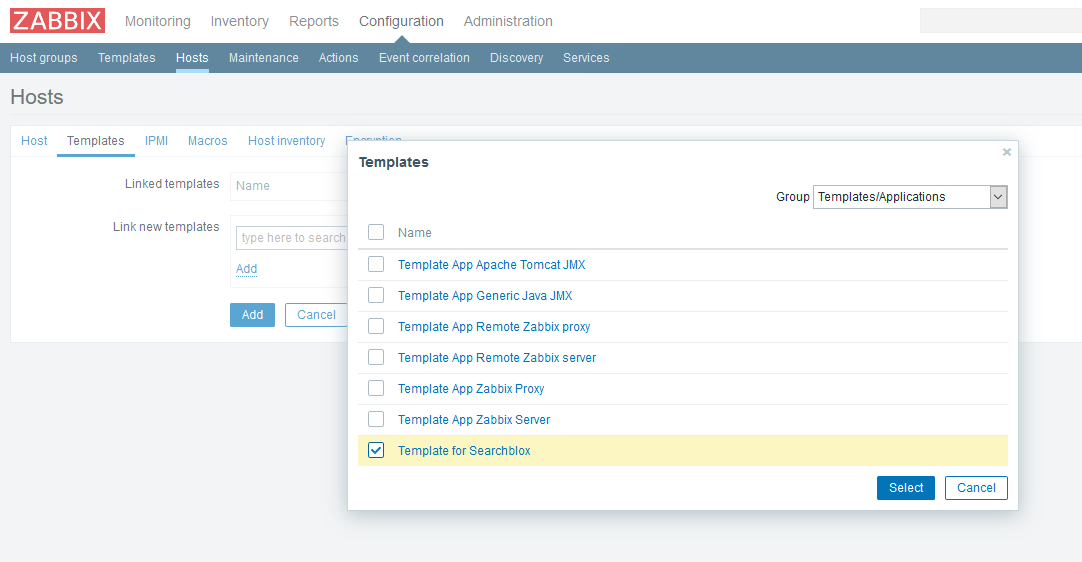
Step 3 - Select the custom Template
- click Template
- click Link new template
- select the Template for SearchBlox
- click Select
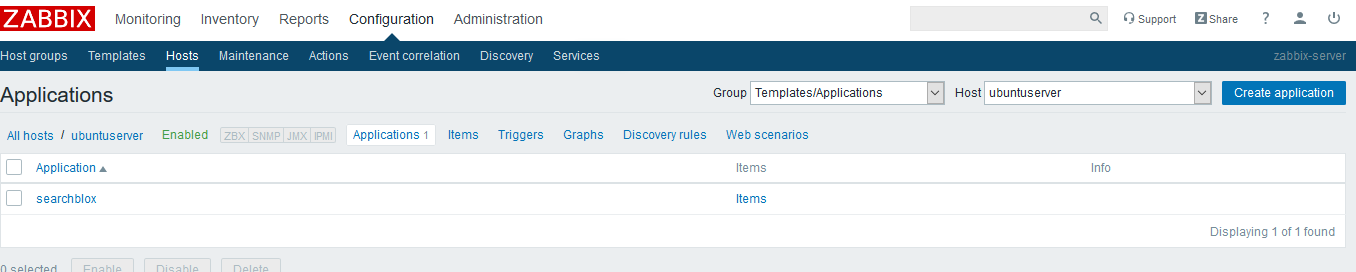
Step 4 - Creating the Application:
- Click Configuration
- Click Hosts
- Select Application Group :
<application Template> - Select Host:
<select created host> - Click Create Application
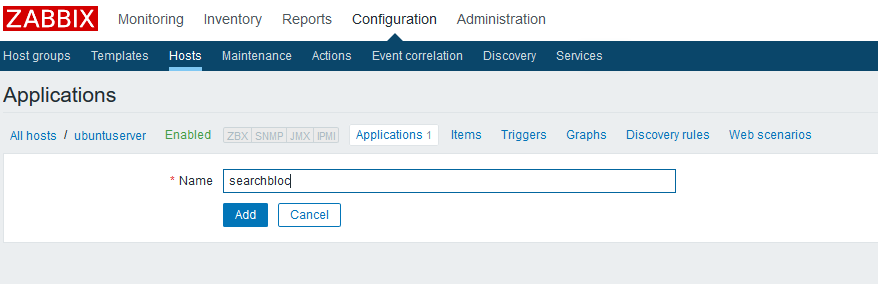
- Name:
<Searchblox> - Click Add option.
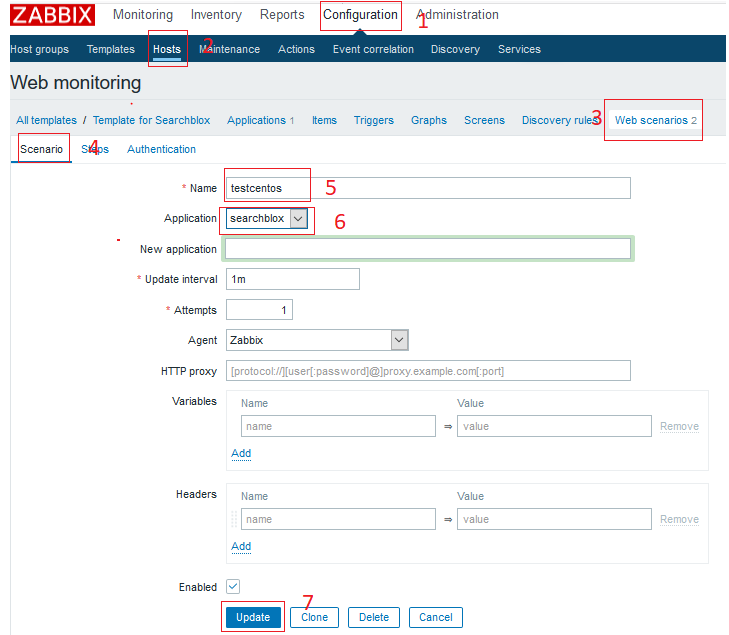
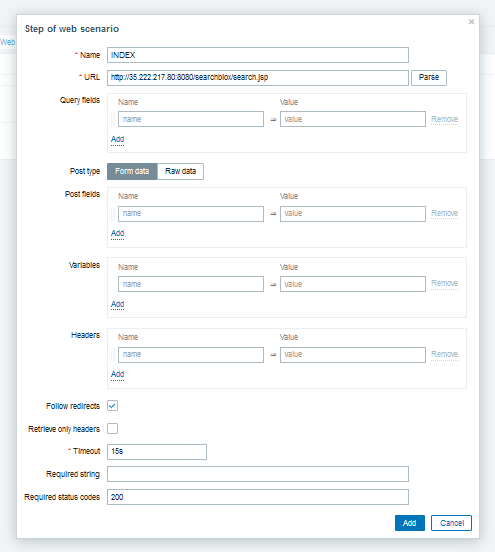
Step 5 – Creating Web Scenario
- Click Configuration
- Click Hosts
- Click Web scenarios
- Click Scenarios
- Name:
<give some meaning full name> - Application:
<select the application Name> - Click Update
- Click Steps
- Name :
<application name> - URL:
<application url> - Click Follow Redirection
Note: status code should be 200 - Click Add button
Step 6 – Monitoring
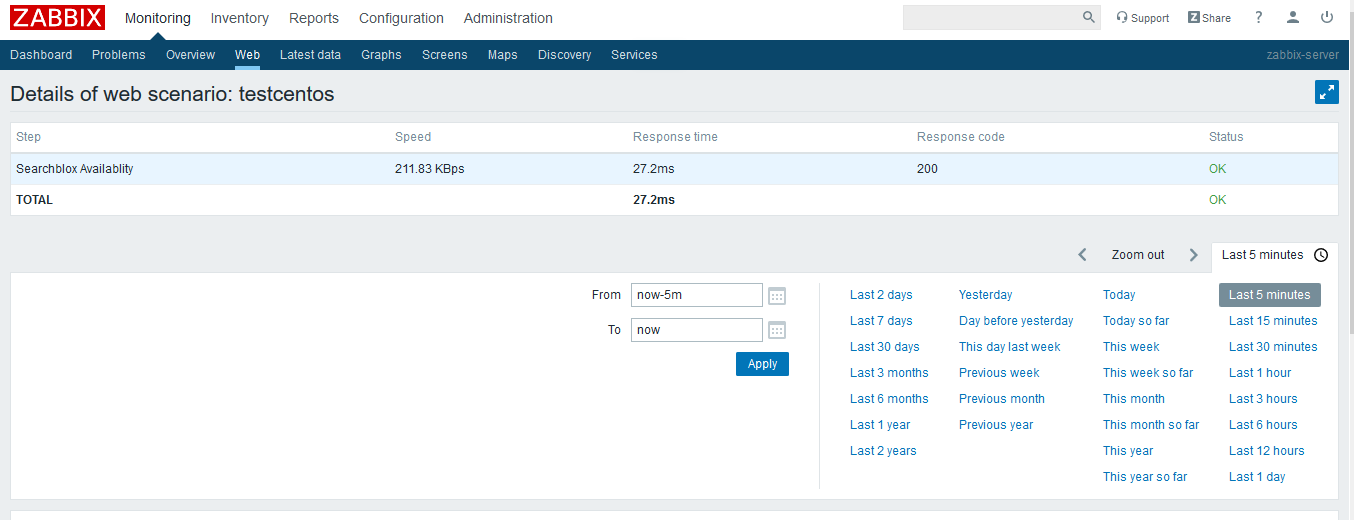
- Click Monitoring
- Click Web
- Select the server
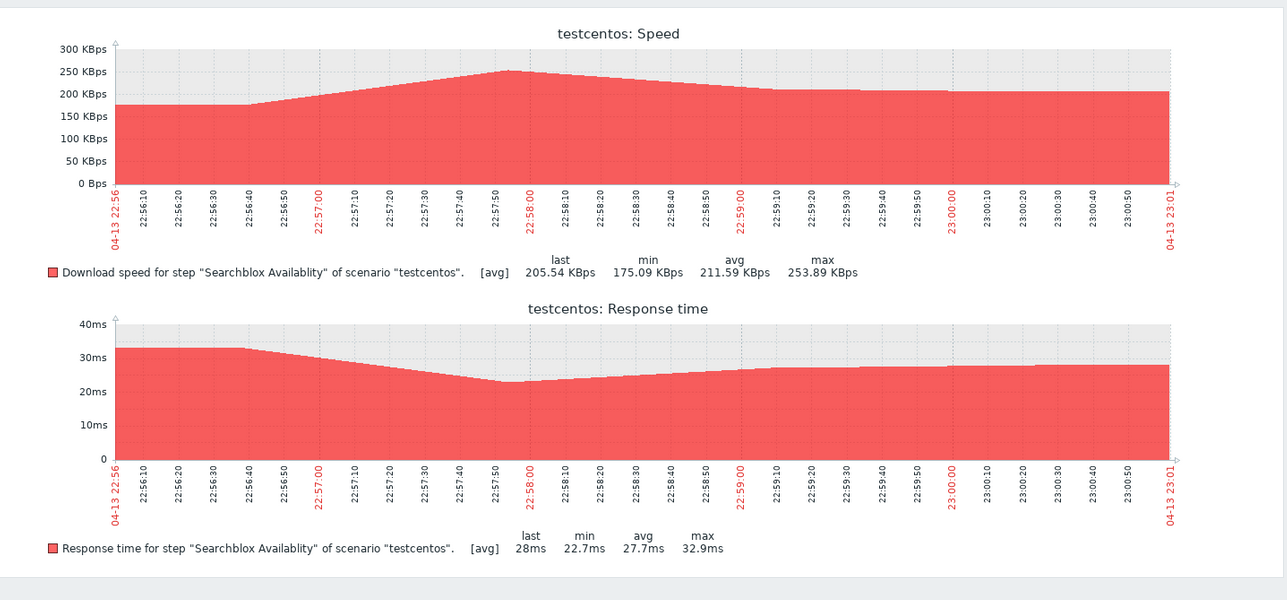
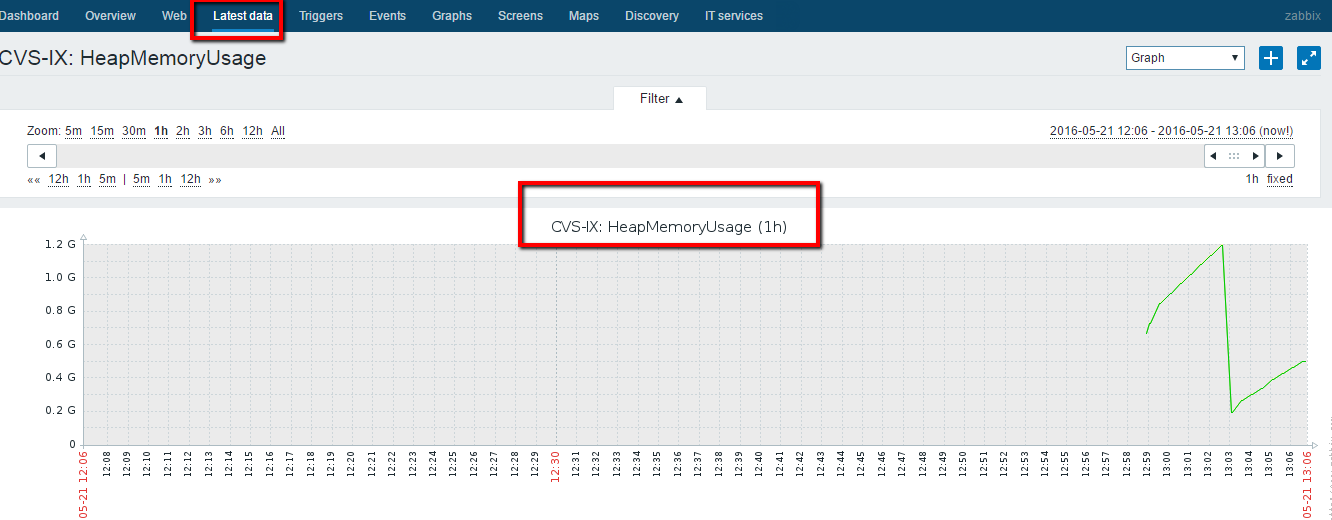
Go to Monitoring -> Latest data
Updated 16 days ago