
Observability
Monitor, debug, and analyse your SearchBlox instance in real time — all from one place.
The Observability dashboard gives administrators a complete view of how SearchBlox is performing. It brings together system health metrics, live logs, error tracking, AI model analytics, and debugging tools into a single page, accessible from Administration → Observability. The dashboard is organised into six tabs:
| Tab | What It's For |
|---|---|
| Overview | Displays a real-time summary of system health and key performance metrics |
| Debugging | Provides tools to trace and investigate requests or system behavior |
| Log Viewer | Lets you browse and search live and historical system logs |
| Errors | Displays and filters recent errors across all SearchBlox components |
| LLM Analytics | Monitors usage and performance of connected AI models |
| Settings | Configures monitoring preferences and data retention settings |
- Overview
The Overview tab provides a real-time snapshot of your SearchBlox instance. Use it to quickly verify that all core services are operating normally before performing deeper troubleshooting or analysis.Key Metrics Displayed- System Status — Indicates whether SearchBlox and OpenSearch services are healthy and operating correctly.
- Active Collections — Shows the number of collections that are currently indexed and available for search.
- Recent Search Activity — Displays the volume of search queries processed during the selected time period.
- AI Model Activity — Shows requests and usage activity for connected LLM providers.
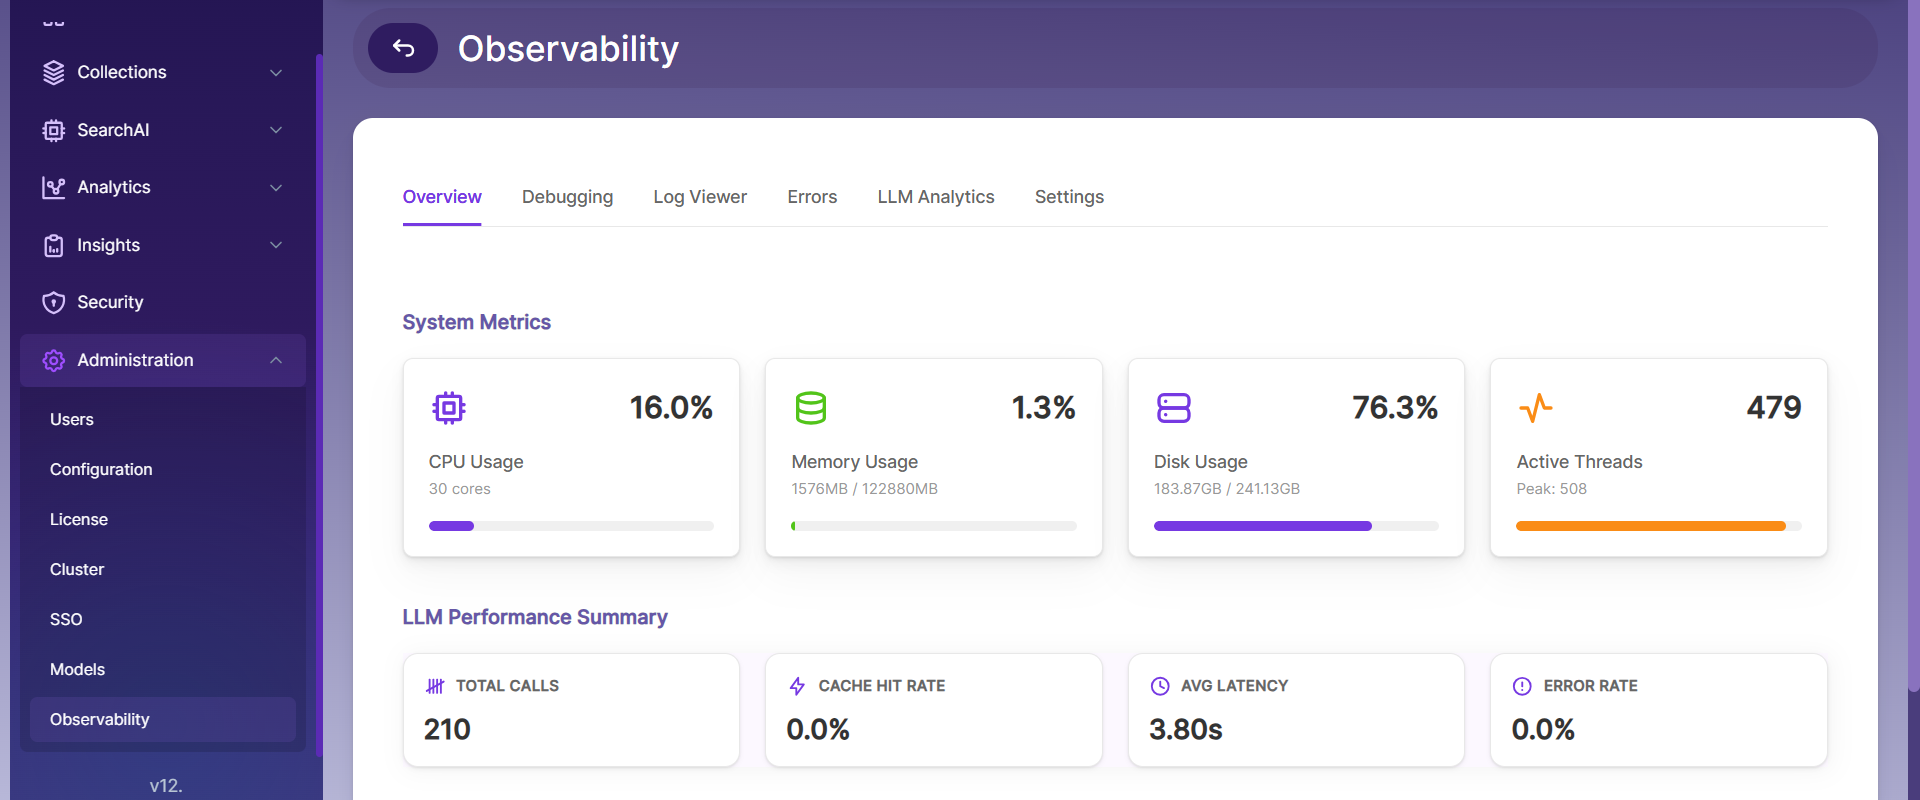
System Metrics
Four metric cards with visual progress bars:
- CPU Usage:Current CPU utilization percentage and available processor cores
- Memory Usage:Heap memory used vs. max (in MB) with usage percentage
- Disk Usage:Disk space consumed vs. total (in GB) with usage percentage
- Active Threads: Current thread count and peak thread count
LLM Performance Summary
Four summary cards providing a quick overview of LLM API activity:
- CPU Usage:Current CPU utilization percentage and available processor cores
- Memory Usage:Heap memory used vs. max (in MB) with usage percentage
- Disk Usage:Disk space consumed vs. total (in GB) with usage percentage
- Active Threads: Current thread count and peak thread count
- Debugging:
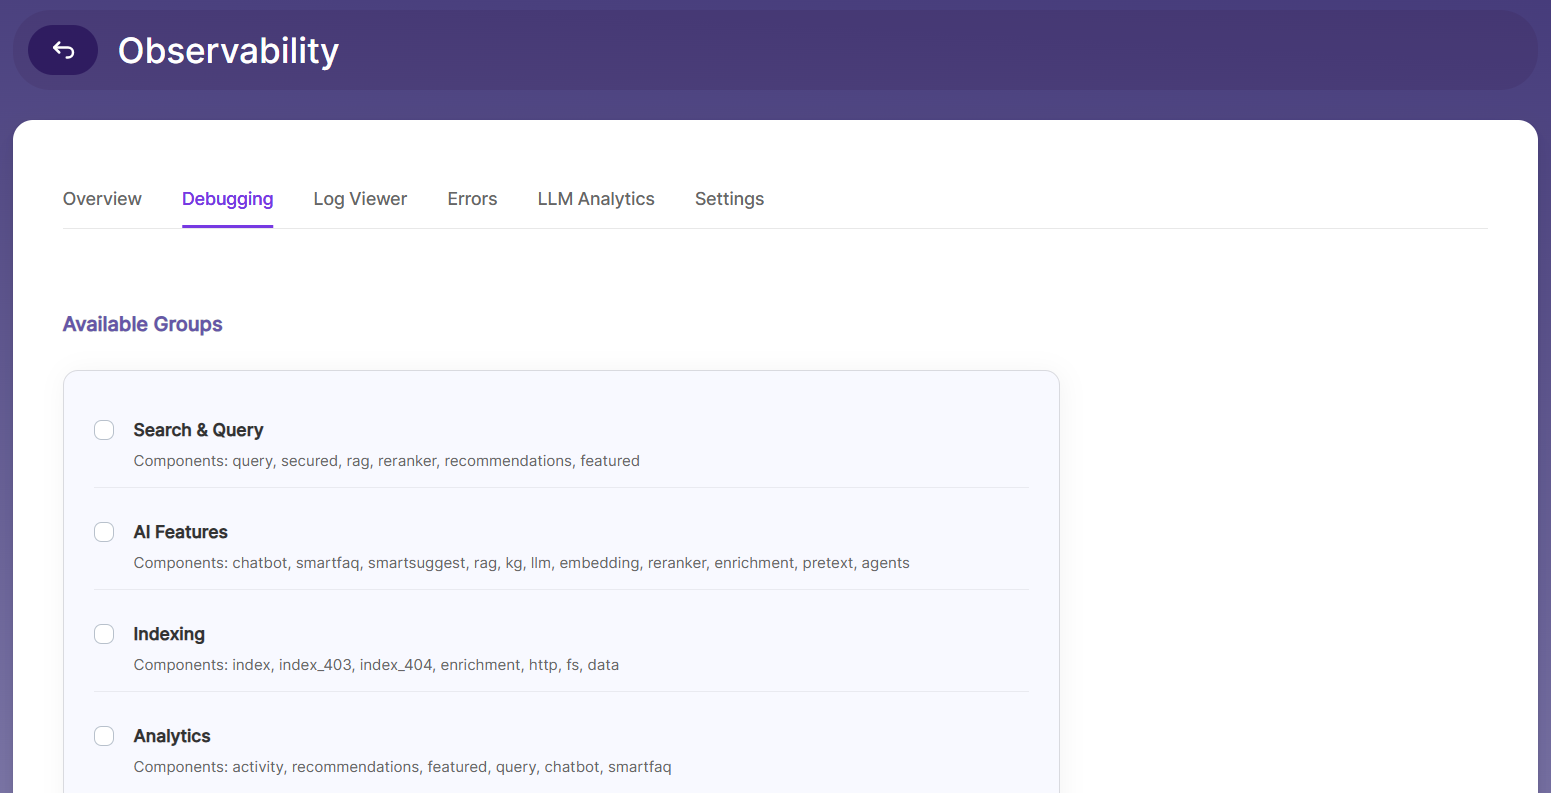
The Debugging tab helps you investigate specific requests, trace how SearchBlox processed a query, or reproduce an issue. It is primarily used by administrators and developers when troubleshooting unexpected behaviour.
Available Groups
● Pre-defined groups of related components (e.g., indexing group, search group).
● Selecting a group automatically selects all its member components.
● Each group displays its name and lists its member component names.
● Groups support indeterminate (partial) selection state when only some members are selected.
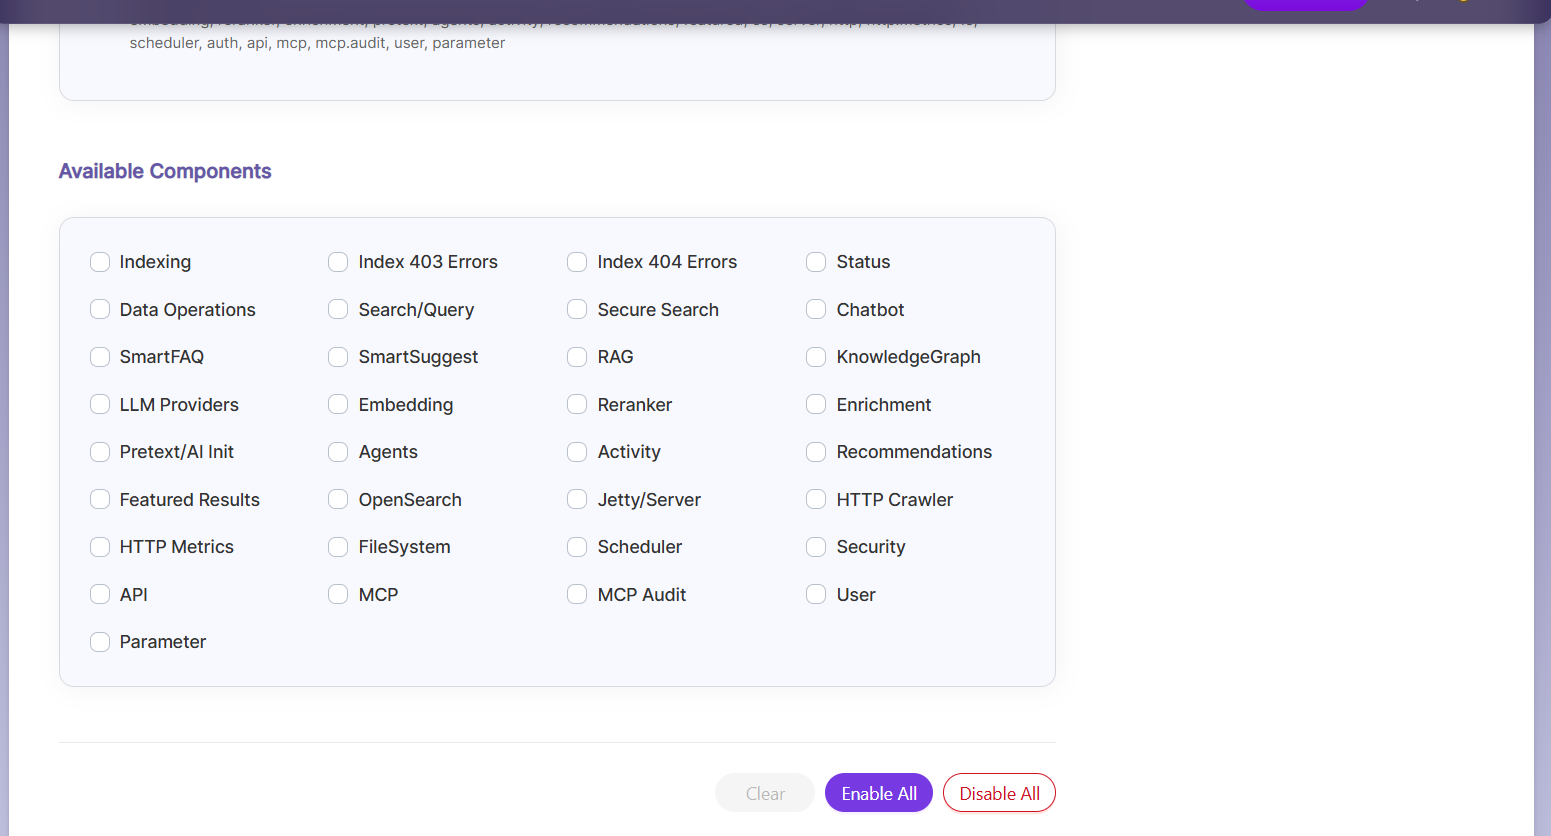
Available Components
● Individual components that can be toggled independently.
● Example components: index, query, chatbot, llm, rag, kg.
● Components with debug currently enabled show an (Enabled) badge.
Action Buttons
Enable:Enables debug logging for the selected groups/components with a configurable timeout
Disable:Disables debug logging for the selected groups/components
Enable All: Enables global debug logging for all components
Disable All:Disables debug logging across all components
Clear:Clears the current selection without making any changes
Note: Debug sessions automatically expire after a configured timeout (default: 30 seconds for individual components, 60 seconds for groups).
- Log Viewer:
The Log Viewer tab provides filtered access to system logs with support for both structured and raw text display.
Filter Controls
Log Level: Multi-select dropdown: Error, Warning, Info, Debug. Defaults to All Levels when none selected.
Count: Number of log entries to retrieve: 1, 50, 100, 150 ... up to 500. Default is 50.
Component: Dropdown to filter by component. Options are loaded dynamically from the API. Default is All Components.
Format: JSON (structured table view) or Text (raw text view). Default is JSON.
Logs are automatically re-fetched whenever any filter value changes.
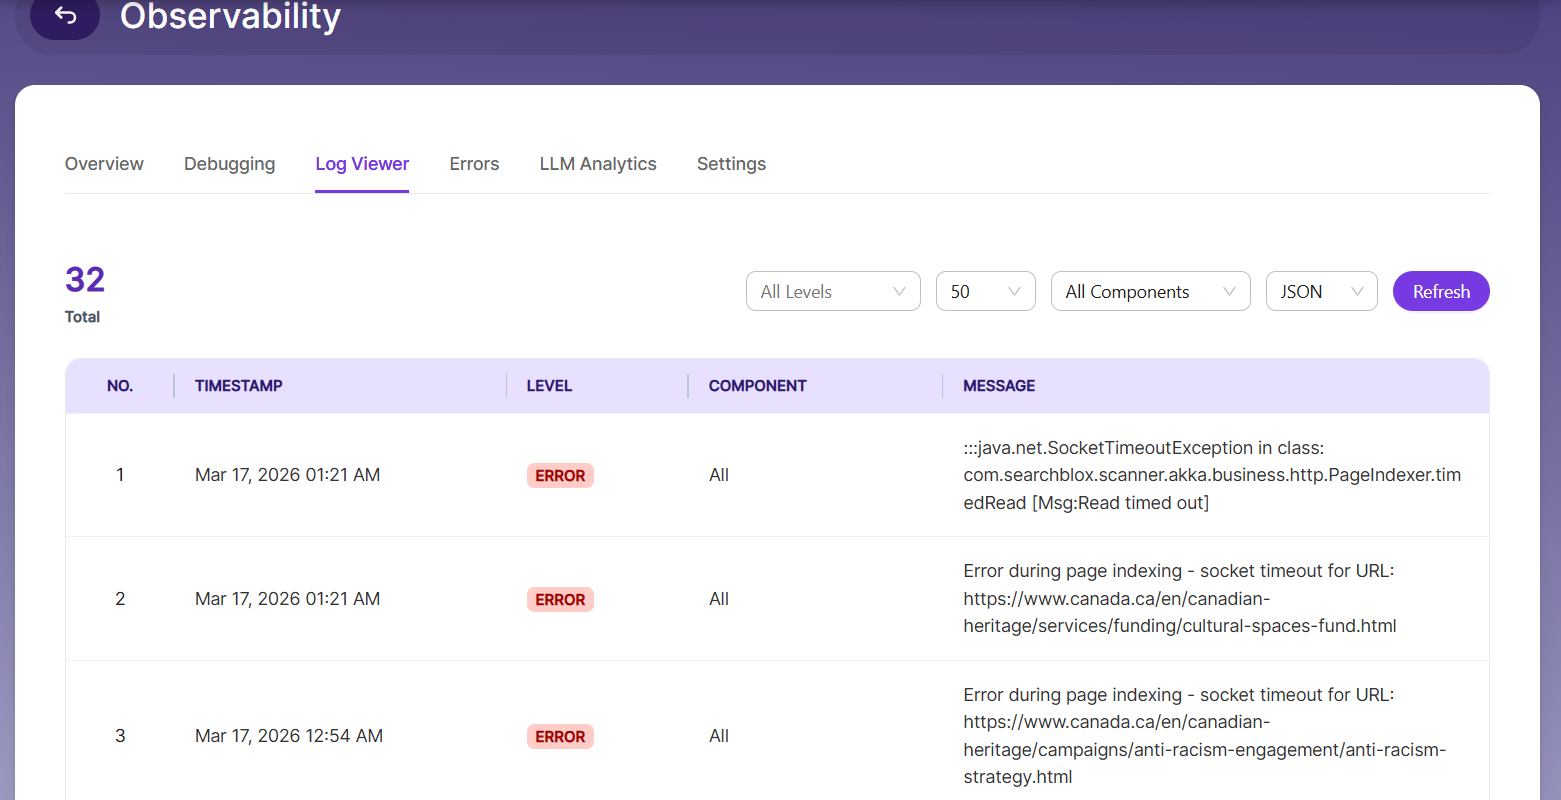
JSON Format – Table View
Displays logs in a paginated table (5 entries per page) with the following columns:
● No. – Row number
● Timestamp – Formatted date/time (e.g., "Mar 17, 2026 02:30 PM")
● Level – Color-coded tag (ERROR = red, WARN = yellow, INFO = default)
● Component – Source component name
● Message – Log message content (truncated with ellipsis for long messages)
Rows are color-coded by severity: error rows, warning rows, and info rows each have distinct styling.
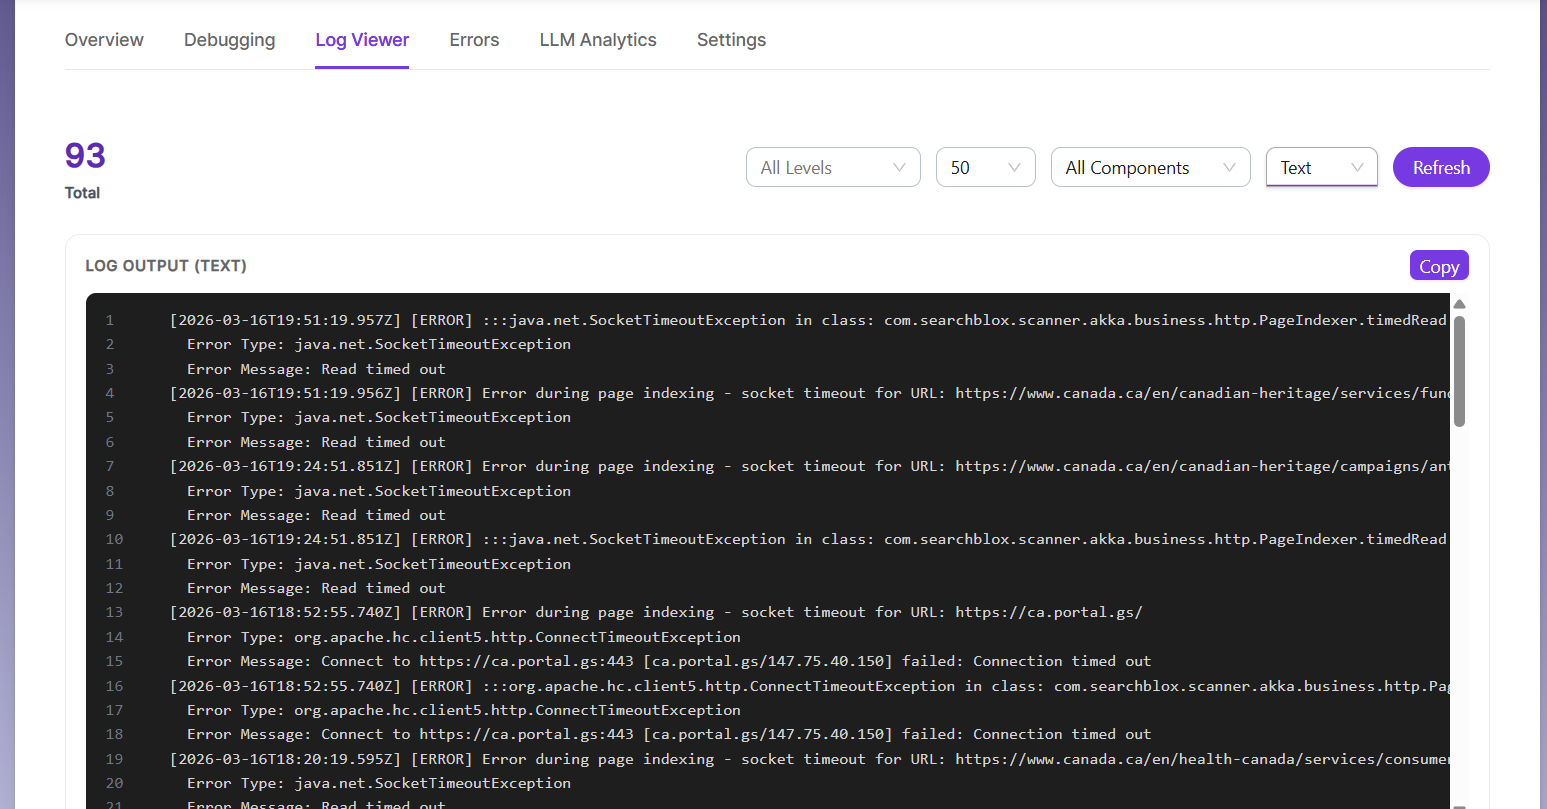
Text Format – Raw View
● Displays raw log output in a monospace pre-formatted block with line numbers.
● Includes a Copy button to copy all log content to the clipboard.
● The Copy button shows a checkmark confirmation ("Copied") for 2 seconds after successful copy.
Total Count & Refresh
● A total count badge displays the number of log entries currently shown.
● The Refresh button manually re-fetches logs with the current filter settings.
- Errors:
The Errors tab provides a filtered view of recent errors across all SearchBlox components. Instead of manually searching through raw log files, this tab surfaces error information directly, making it easier to identify and resolve issues.
What You Can Do
- View Errors by Component or Time — Group and filter errors based on the affected component or a specific time period.
- Identify Recurring Issues — Review error frequency to detect patterns and frequently occurring problems.
- Inspect Error Details — Click an error entry to view the complete log message and additional context for troubleshooting.
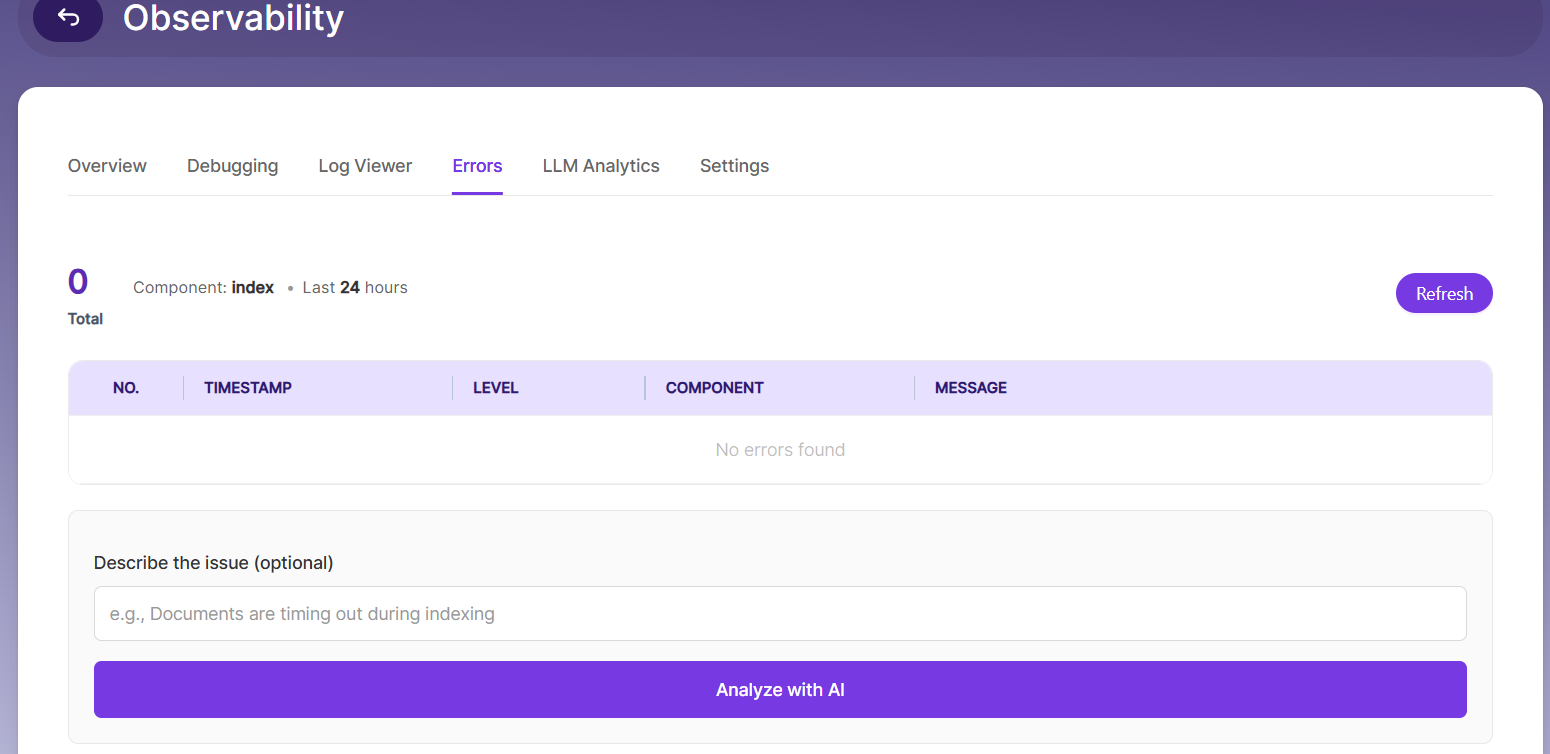
Error Summary Header
● Displays the total error count for the monitored component.
● Shows metadata: the component being monitored and the time window (e.g., last 24 hours).
● Refresh button to reload error data from the API.
Top Error Patterns
● Lists recurring error patterns identified in the logs.
● Each pattern shows the pattern text and its occurrence count.
● Helps administrators quickly identify the most common failure modes.
Error Log Table
Paginated table (5 entries per page) with columns:
● No. – Row number
● Timestamp – Displayed as relative time (e.g., "24 hours ago")
● Level – Always shown as ERROR with a red tag
● Component – Source component
● Message – Error message content
AI-Powered Analysis
● Optional text input field to describe the issue (e.g., "Documents are timing out during indexing").
● "Analyze with AI" button sends error logs along with the issue description for AI-powered analysis.
● If no description is provided, the system uses detected error patterns as context.
Analysis results are displayed in structured, visually distinct sections:
Summary: Brief overview of the error pattern and its impact
Severity: Rated severity level: CRITICAL, HIGH, MEDIUM, or LOW, displayed as a badge
Root Cause: Identified underlying cause of the errors
Recommendations: Numbered, actionable steps to resolve the issue
- LLM Analytics:
The LLM Analytics tab provides detailed metrics on LLM provider usage and response performance.
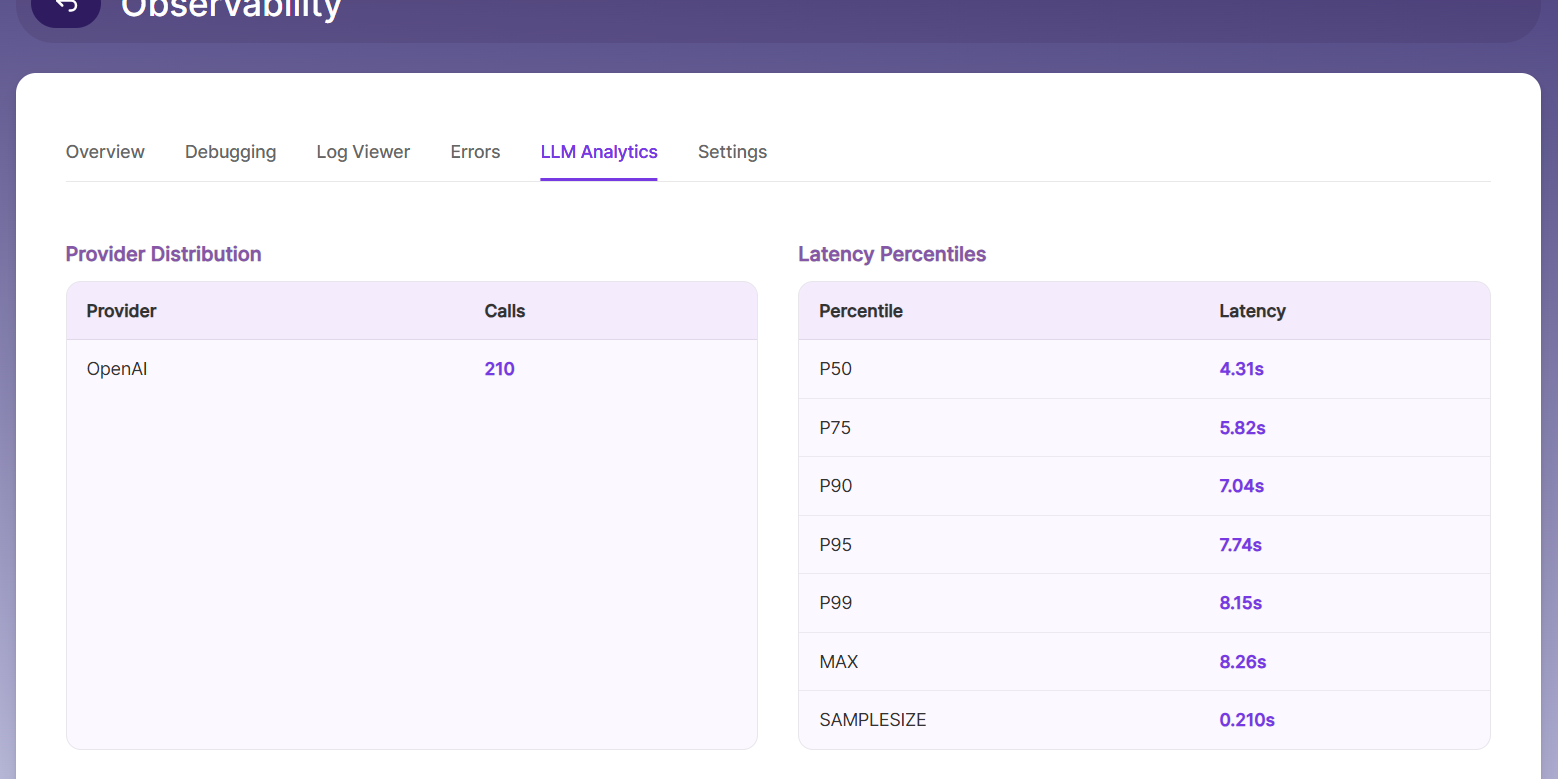
Provider Distribution
A table showing each configured LLM provider and the number of API requests made to it.
Supported providers:
● OpenAI
● Anthropic
● Ollama
● Azure OpenAI
● Google Gemini
● AWS Bedrock
● LlamaCpp
● ONNX
Latency Percentiles
A table showing response time distribution across percentiles (e.g., p50, p75, p90, p95, p99).
● Values are displayed in seconds.
● Data covers the last 24 hours by default.
● Helps identify tail latency and performance outliers.
- Settings:
The Settings tab configures log storage destinations, retention policies, and external integrations.
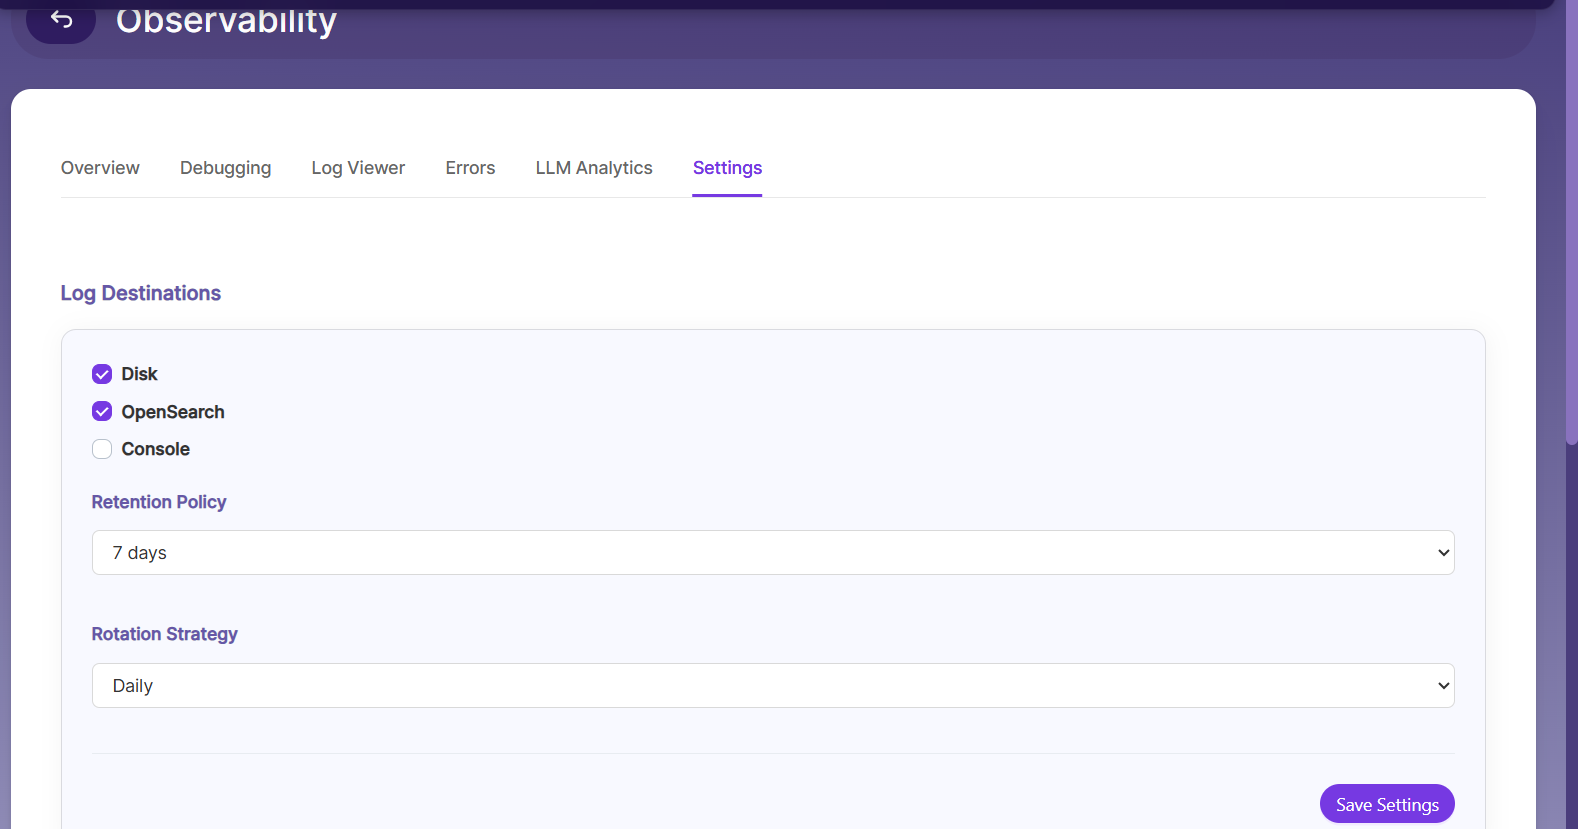
Log Destinations**
Select where logs are stored. Multiple destinations can be enabled simultaneously:
Disk: Write logs to local disk storage
OpenSearch: Send logs to the internal OpenSearch instance for indexing and search
Console: Output logs to the application console (stdout)
Retention Policy
Configure how long logs are retained before being automatically purged. Available options are loaded from the server and typically include: 7 Days, 15 Days, 30 Days, 60 Days, and 90 Days.
Rotation Strategy
Configure how frequently log files are rotated. Available options are loaded from the server and typically include: Hourly, Daily, and Weekly.
Click Save Settings to apply the destination, retention, and rotation configuration.
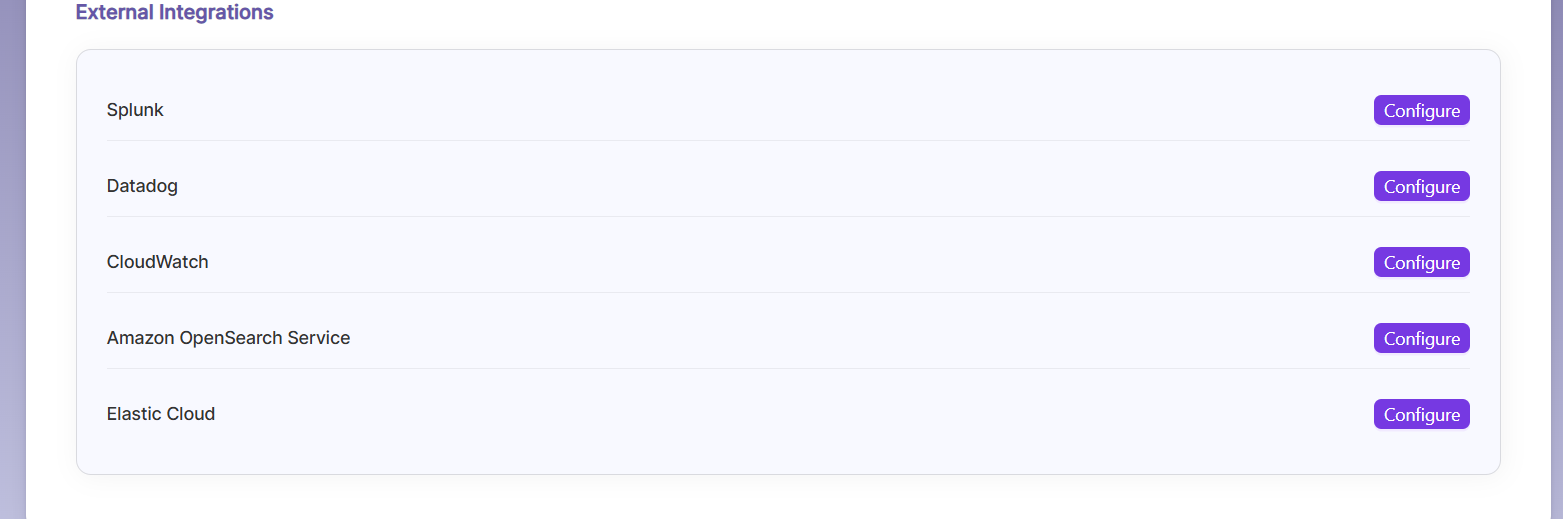
External Integrations
Forward logs to external observability platforms. Each integration can be independently configured, enabled, and disabled.
Splunk: Endpoint URL, HEC Token, Index name
Datadog: API Key, Site (e.g., datadoghq.com), Service name
CloudWatch: AWS Access Key ID, Secret Access Key, Region, Log Group Name
Amazon OpenSearch Service: Endpoint, Region, Auth Type (IAM with Access Key/Secret, or Basic Auth with Username/Password)
Elastic Cloud: Auth Type: Cloud ID + API Key, Endpoint + API Key, or Basic Auth (Endpoint + Username/Password)
● Each integration shows its current status (Enabled or Disabled).
● Enabled integrations display a Disable button and a Reconfigure button.
● Disabled integrations display a Configure button that opens a configuration modal.
● The configuration modal provides input fields specific to each integration and an Enable/Update button to save.
Updated about 2 months ago