Kibana Visualizations
Kibana Visualizations Simplified With SearchBlox
With Kibana in SearchBlox, visualizations and dashboards for any type of data are easy to create, share and embed. Now you can set up a real-time feed from external application as well as SearchBlox for tracking any hashtag or keyword and track them live on your visualization. Need to see what’s inside your corpus of data? Our visualizations will tell you. Tracking database transactions in near-real time is now feasible through SearchBlox Kibana visualizations.
Please ensure SearchBlox is already installed, running, and at least one collection has indexed documents, tweets or pages.
To learn more about Kibana, visit https://opendistro.github.io/for-elasticsearch-docs/docs/kibana/.
Step 1 – Start Kibana
Start Kibana by going to /opt/searchblox/kibana/bin or C:\SearchBlox Server\kibana\bin and running:
./kibana
or
kibana.bat
Step 2 – Access Kibana
Open your browser to http://localhost:5601.
It is also possible to configure Kibana on your IP or domain. The changes are to be made in
../kibana/config/kibana.yml
Please add the following line
server.host: 0.0.0.0
You can also give your IP as server host.
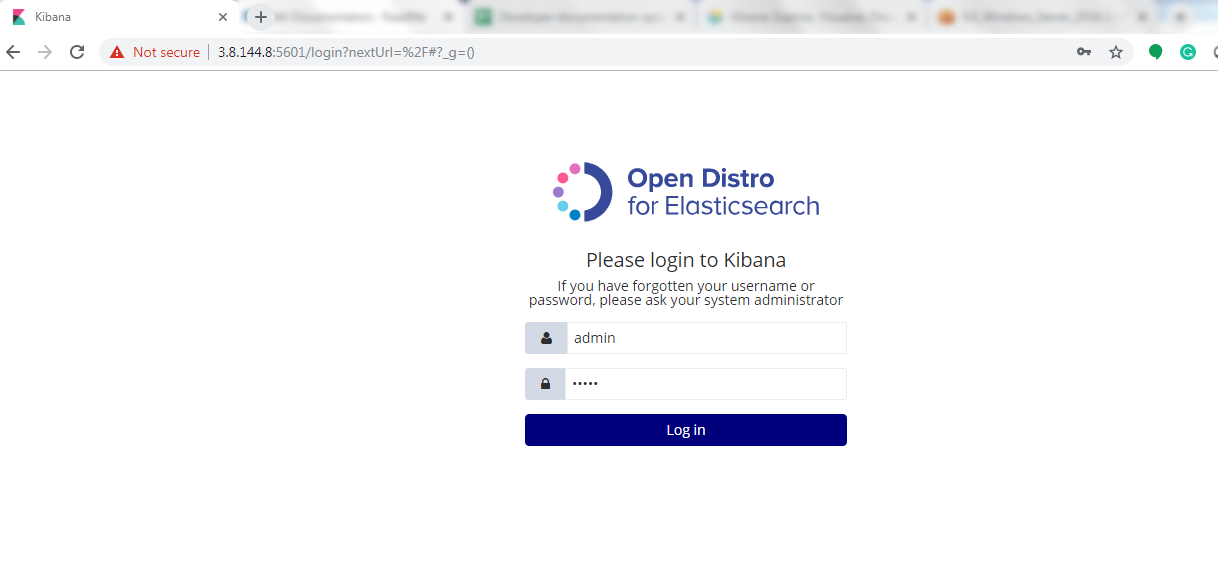
Step 3 - Login to Kibana
Once you start accessing Kibana using the URL
http://:5601
Please give default Elasticsearch credentials,
Note: You can find the Elasticsearch login credentials in the searchblox.yml file, found in the following file path:
\SearchBloxServer\webapps\searchblox\WEB-INF
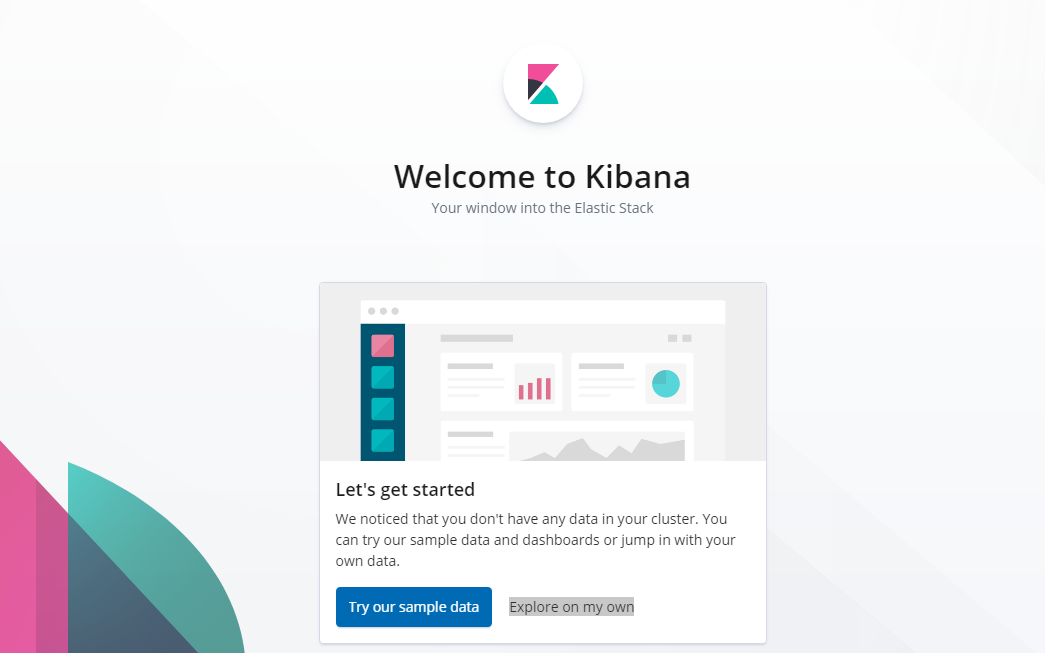
After logging in you would get the following page. Please click Explore on my own
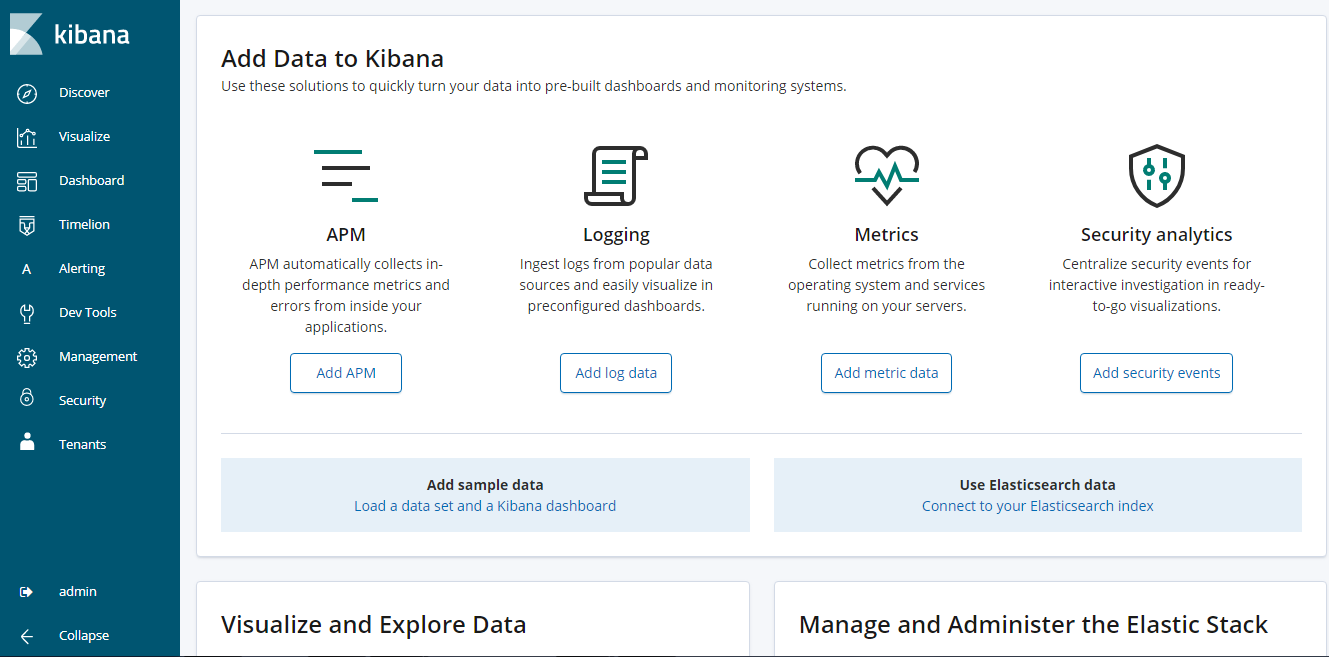
Step 4 - Configure Index in Kibana
Click Management on the left-hand menu to configure your index. Click Index Patterns
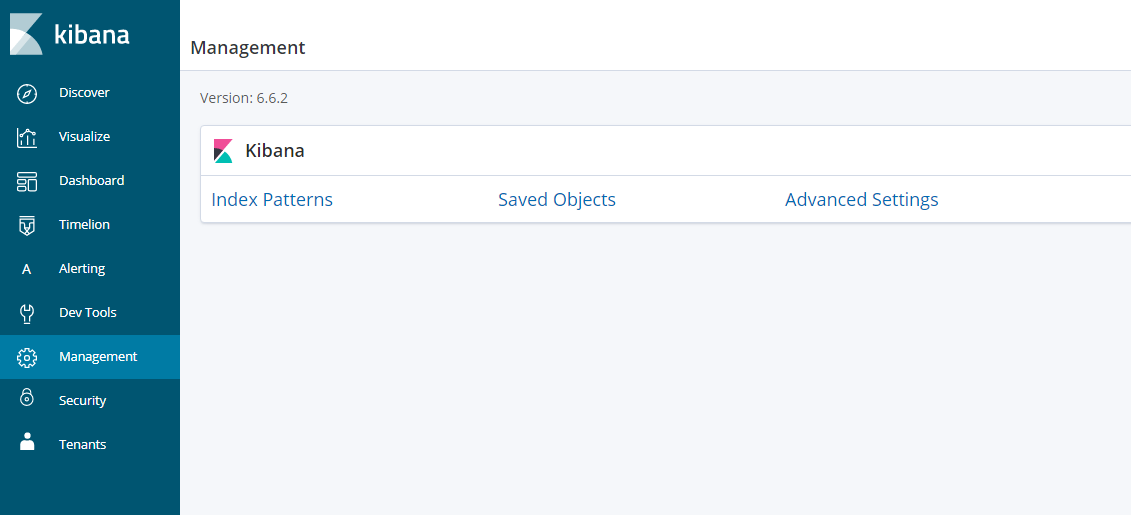
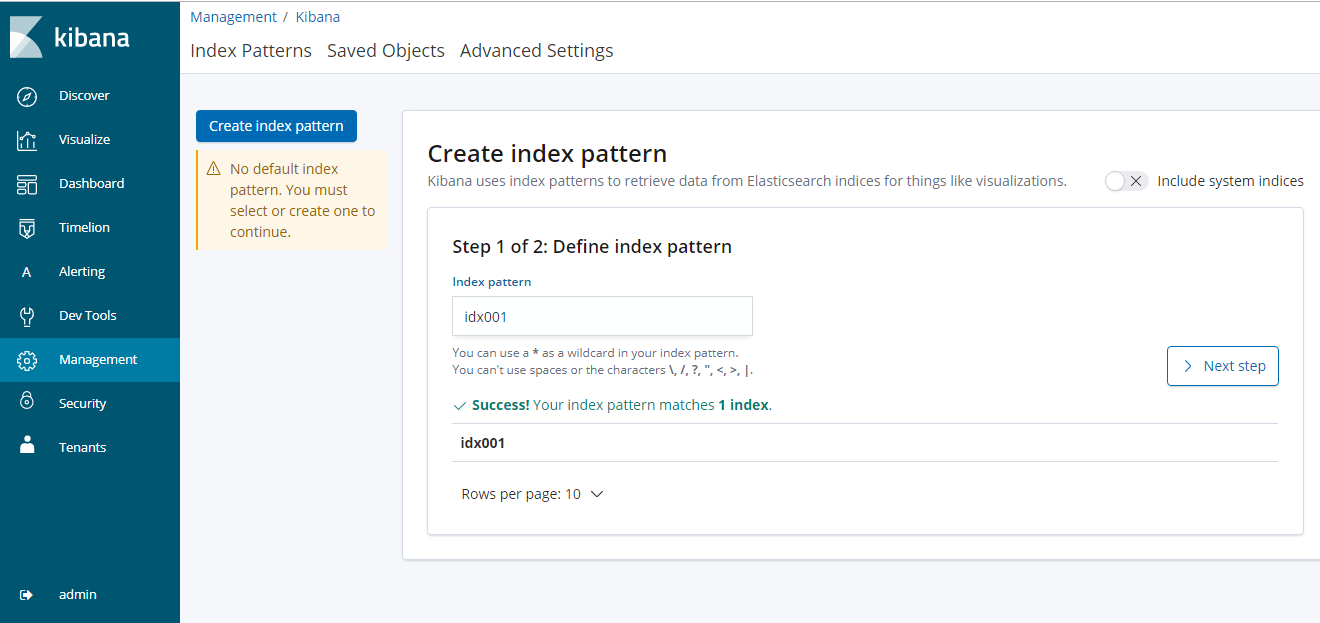
Give the Index ID (For example Collection ID 1 = idx001) and click Next Step
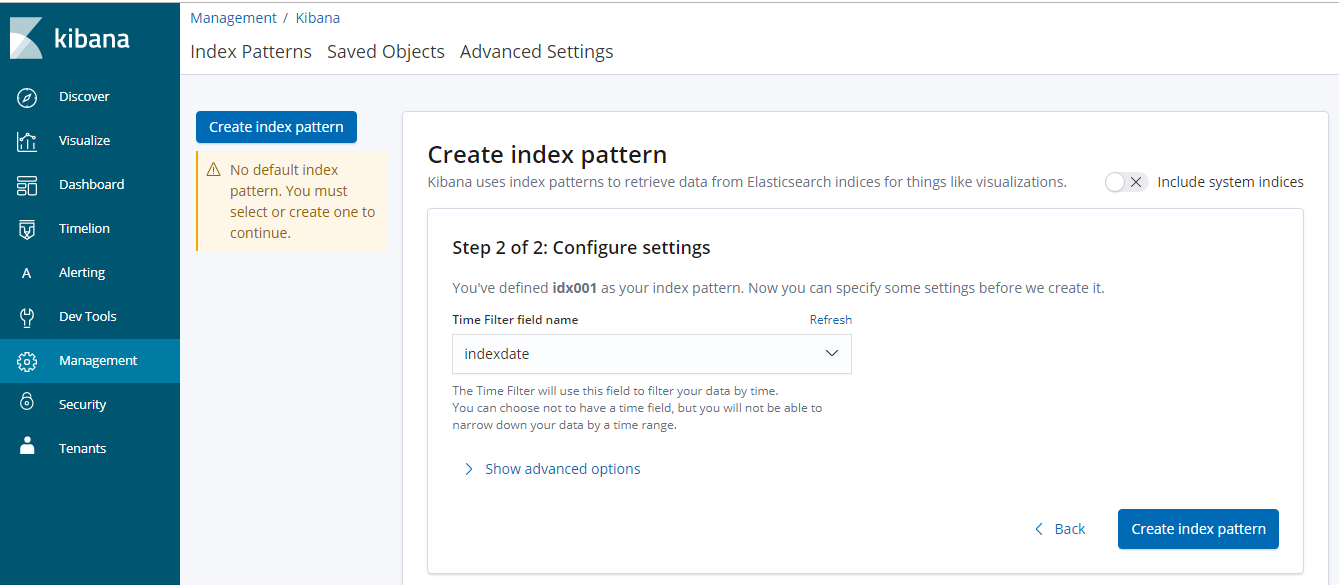
Give Time filter field name such as indexdate or lastmodified, etc. and click Create index pattern
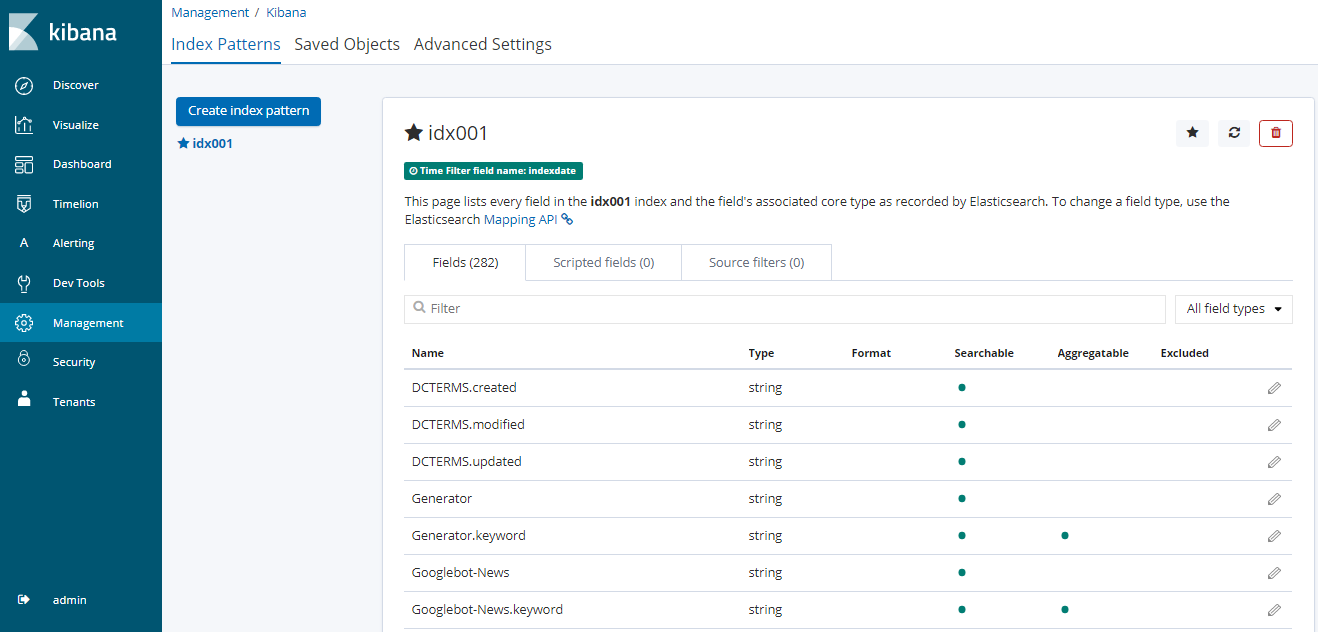
You would be able to view the index pattern with the fields as shown here
Step 3 – Create Visualization
In our documentation, we will show how to create few basic visualizations in Kibana
Click on the Visualize tab in menu to create a new visualization from the index.
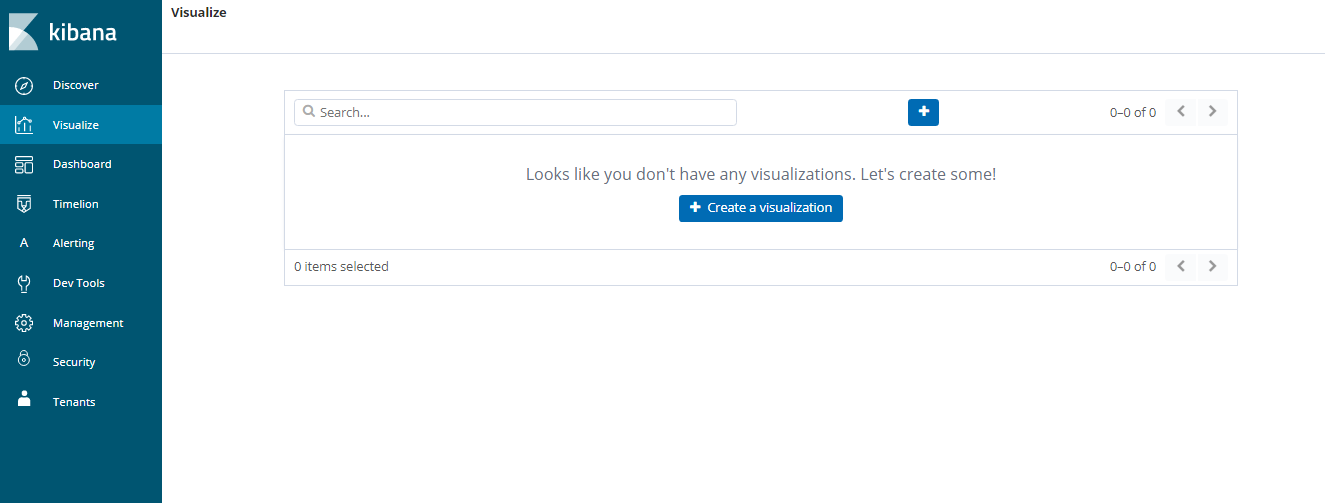
Click Create Visualization, you would be able to view the available visualizations
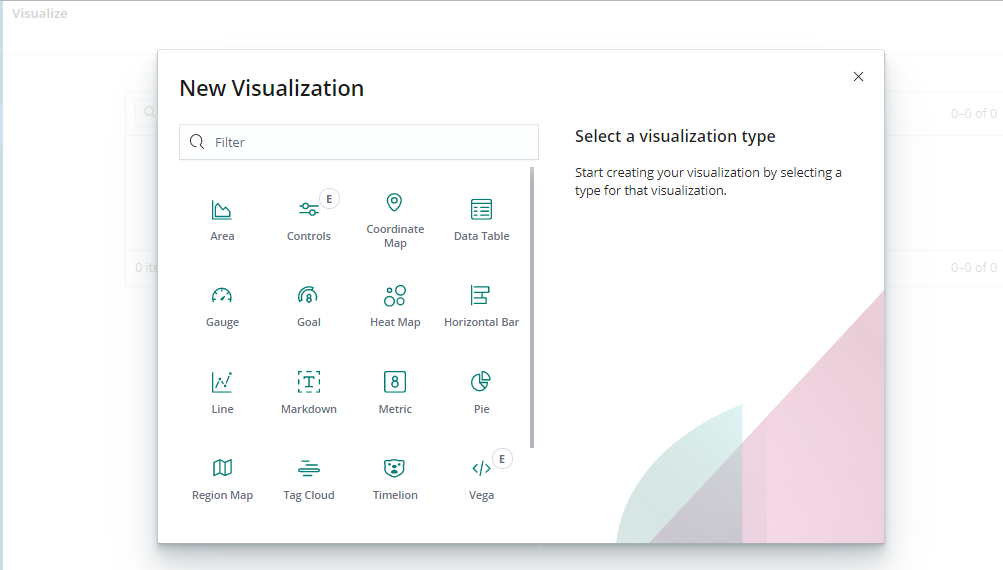
You can select any visualization based on your requirement and data. For example here we will use pie chart
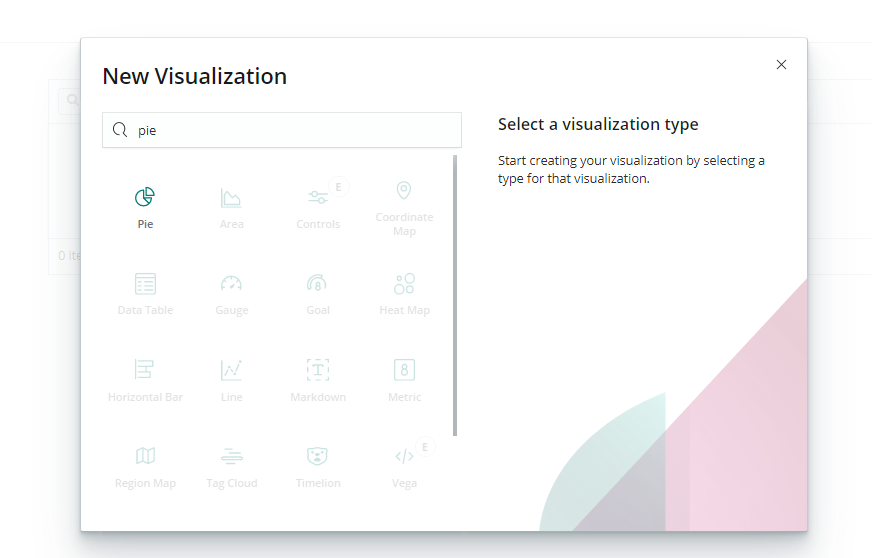
Step 4 – Visualize
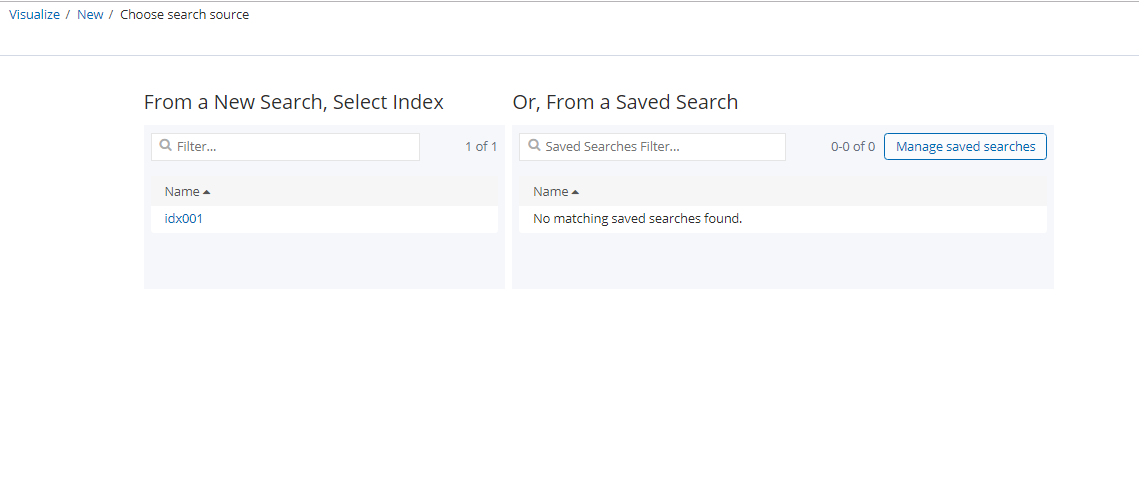
After selecting the visualization, select the index.
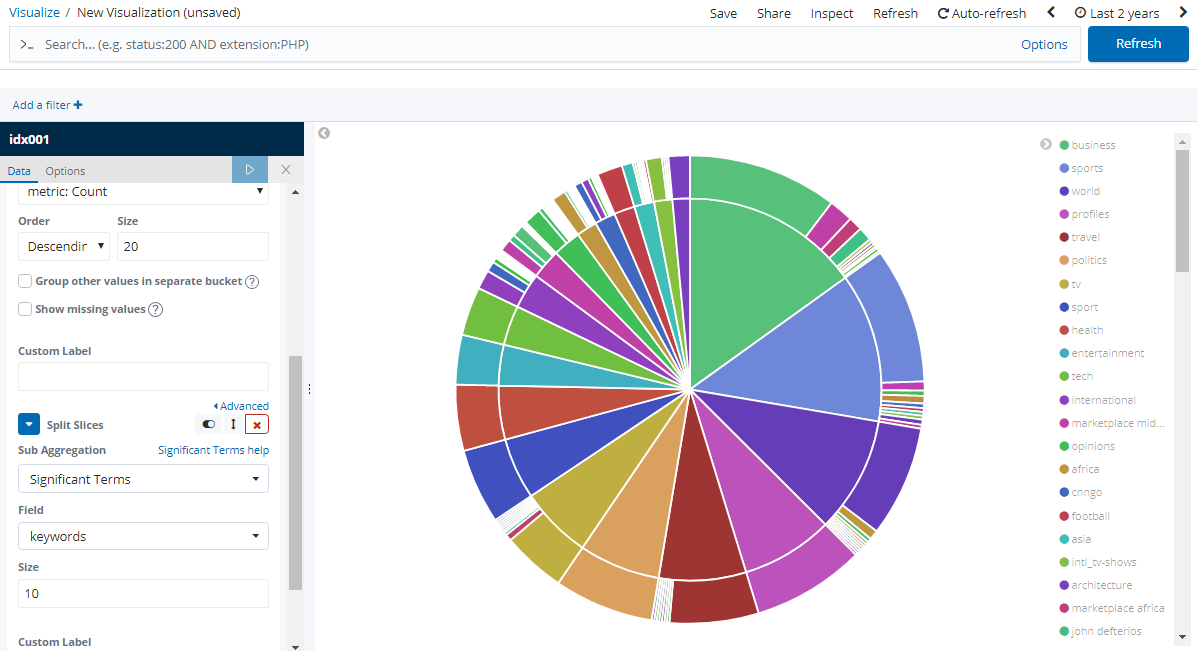
Configure the aggregation type and the field for this aggregation. In our example, we have selected aggregation as terms and field as keywords and then click the play button on top for execution.
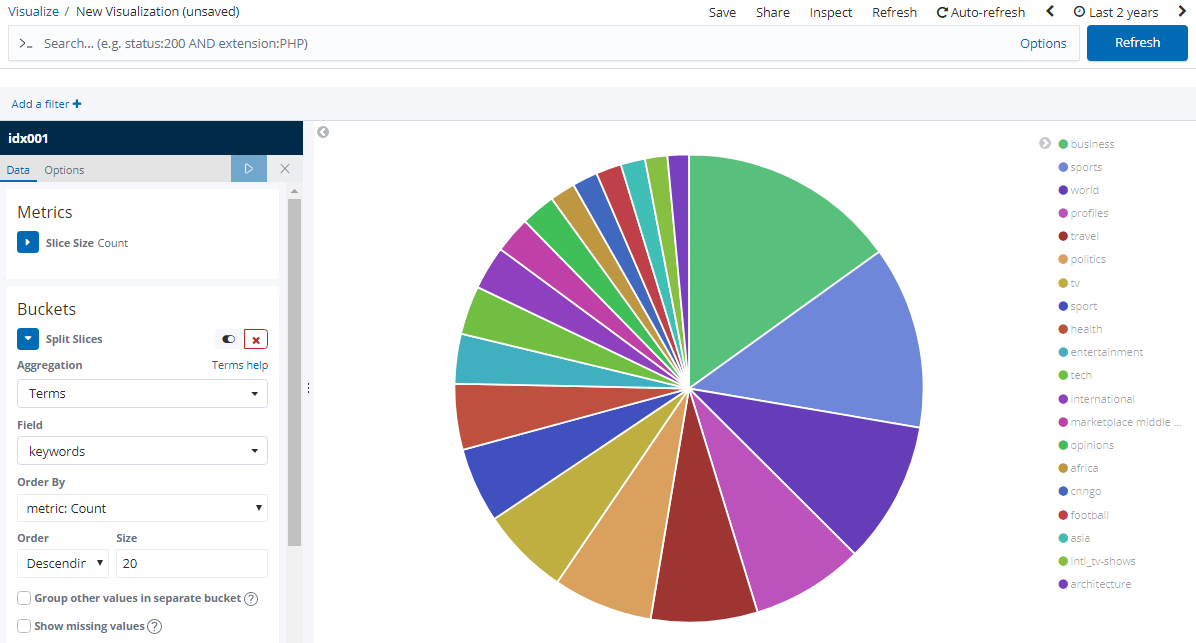
You can add subbuckets and generate visualization as shown here:
Selecting Time Range
Please make sure to select the time range in the top left corner of the page. Data will not be aggregated if the right time range is not selected as by default data from last 15 minutes will be the date range selected as shown here:
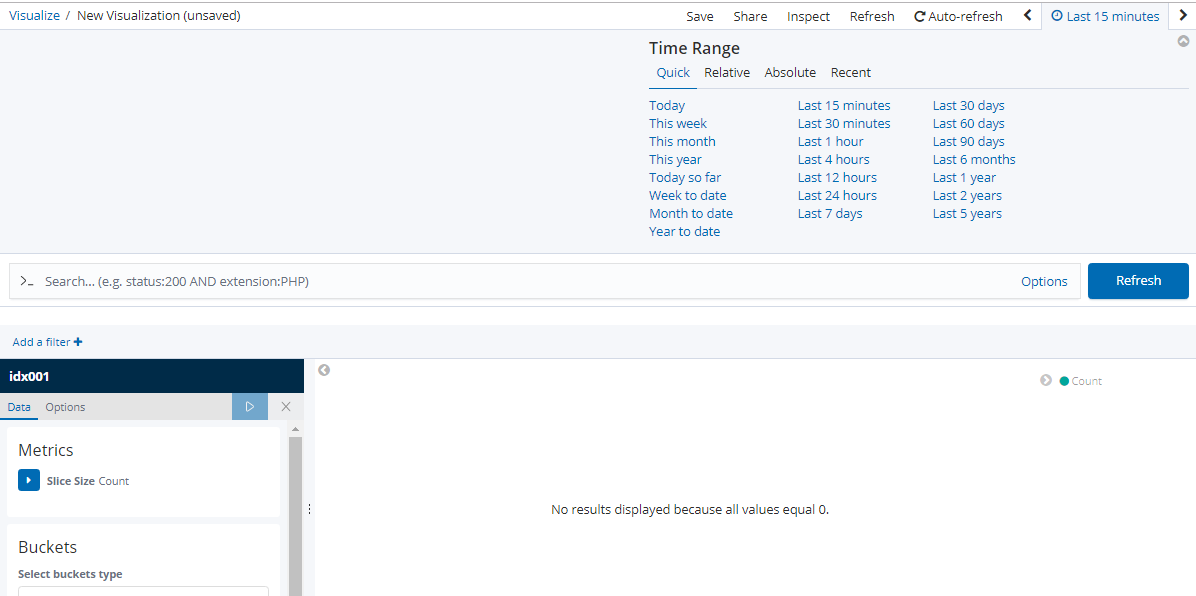
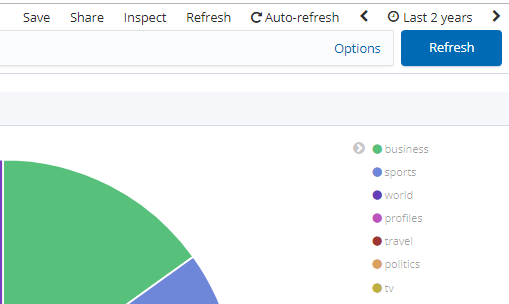
Explicitly select the date range in years or months based on your requirement
Dashboard
You can save the visualization and add it to the dashboard.
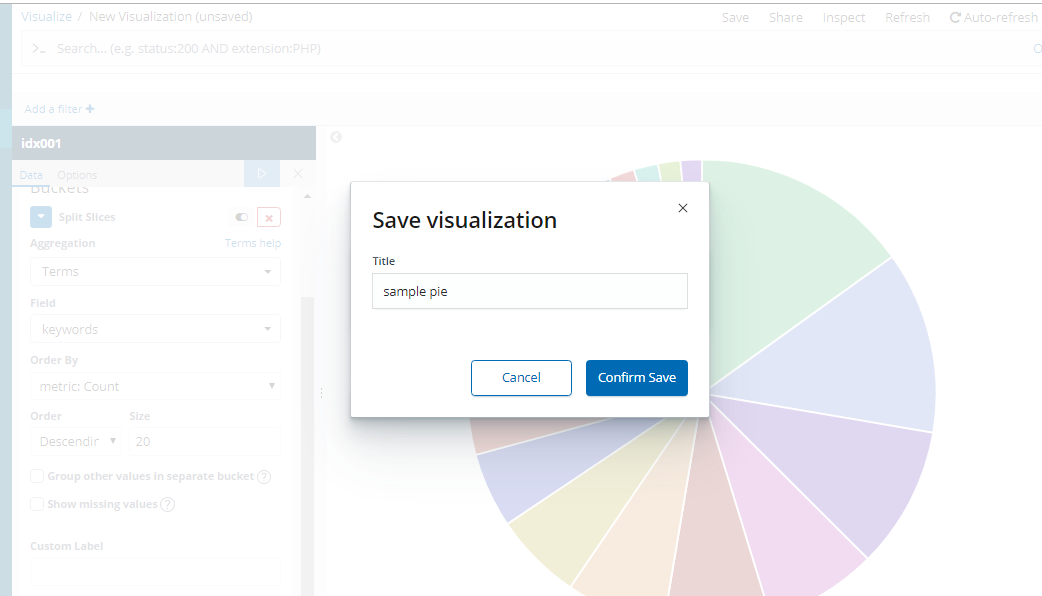
You can view the saved visualizations by clicking Visualization tab in menu
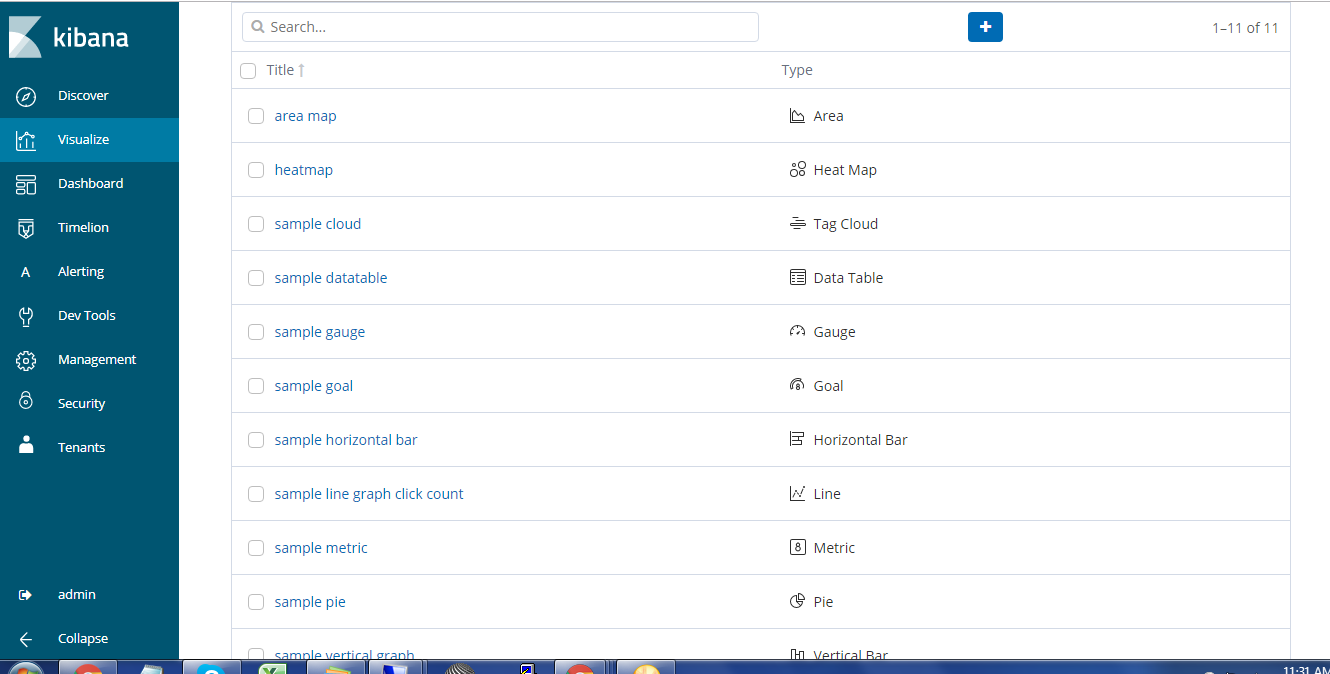
You can add these visualizations to dashboard
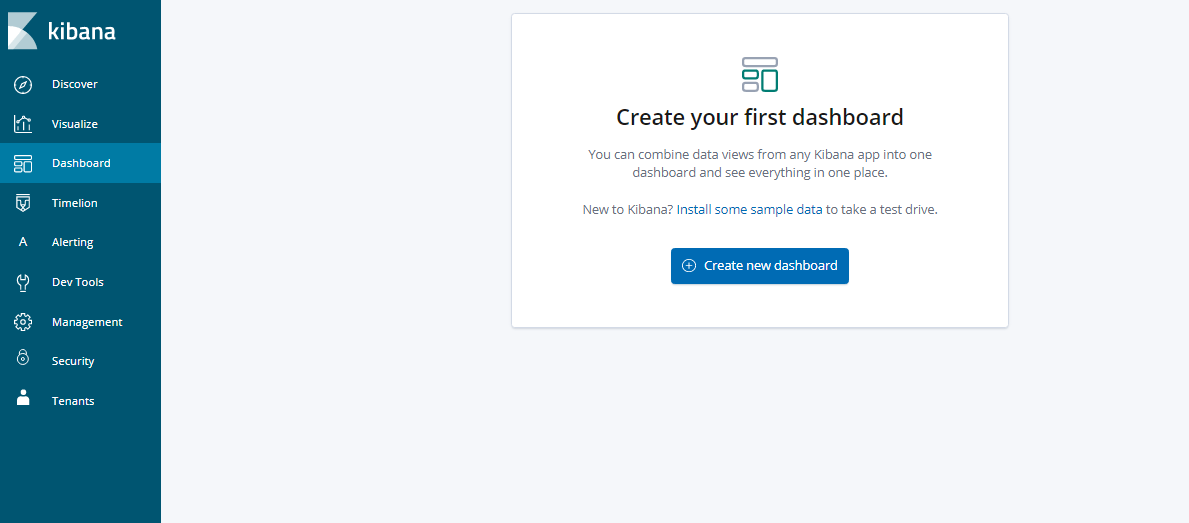
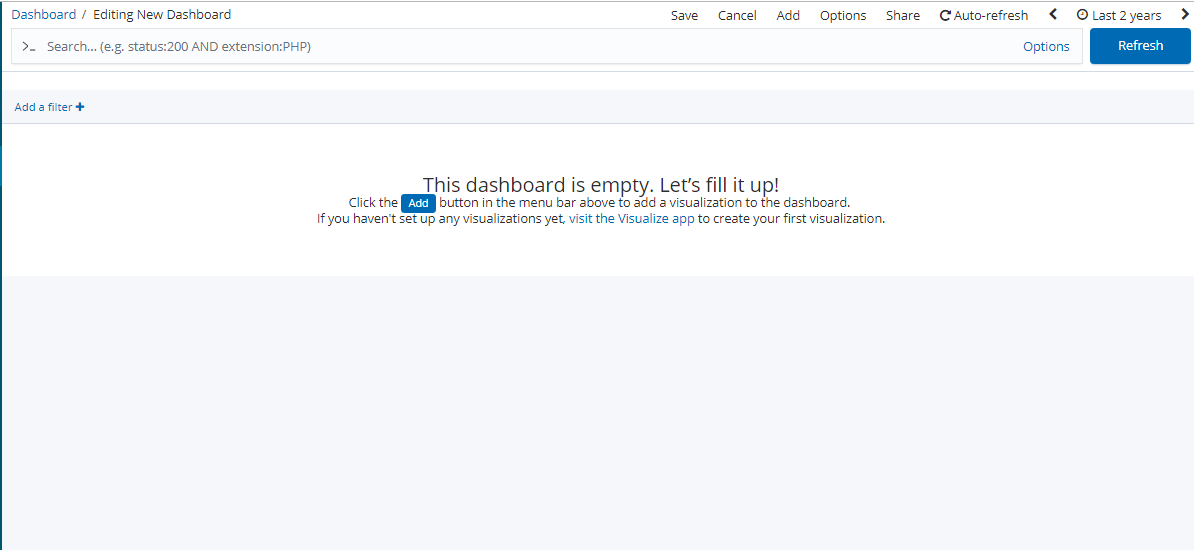
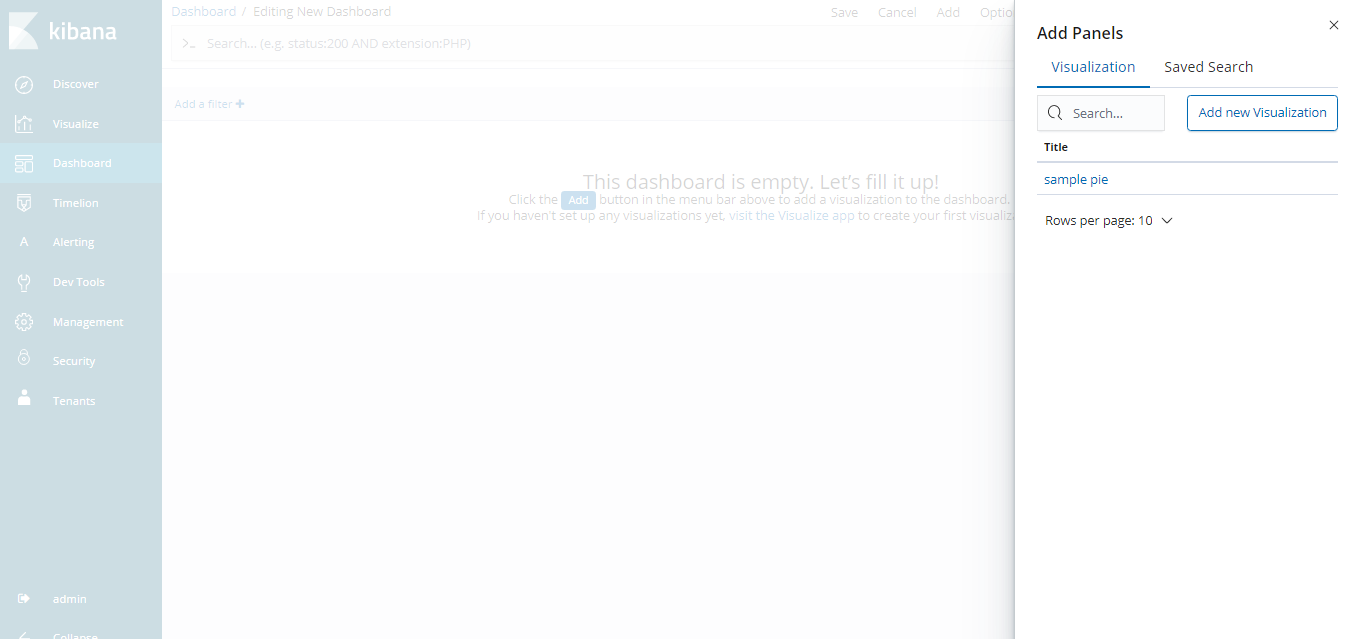
You can create multiple visualizations and add them to dashboard as shown here:
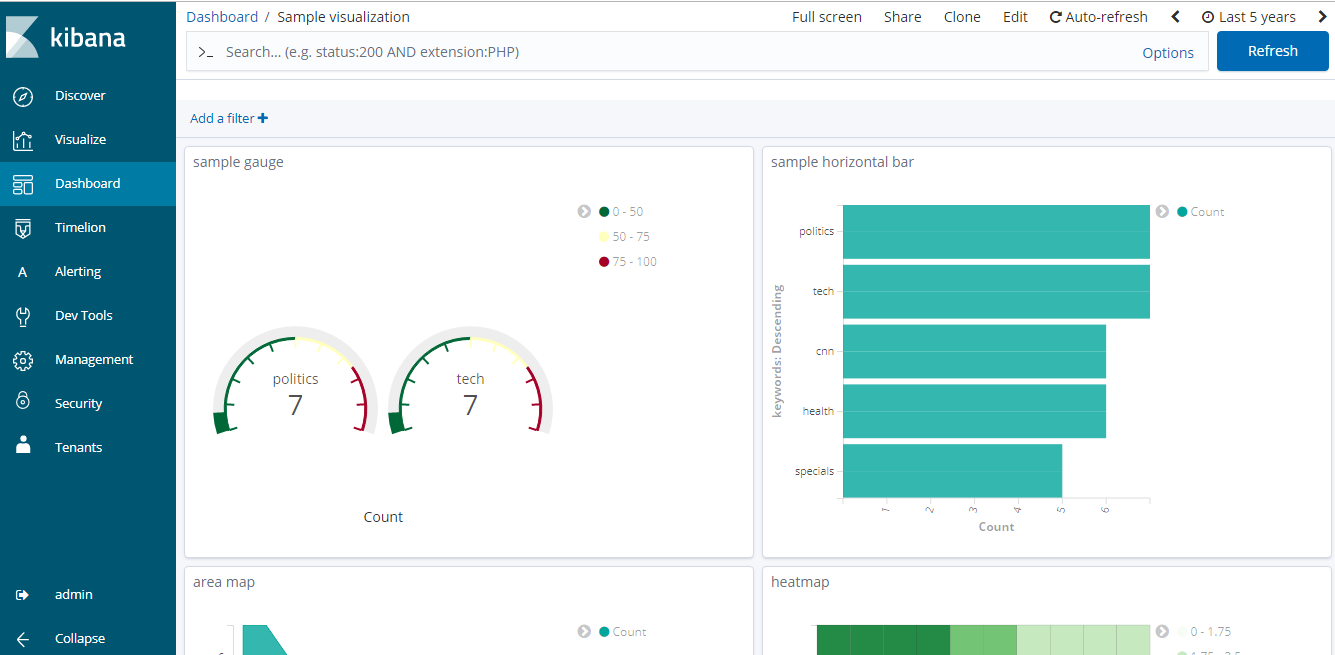
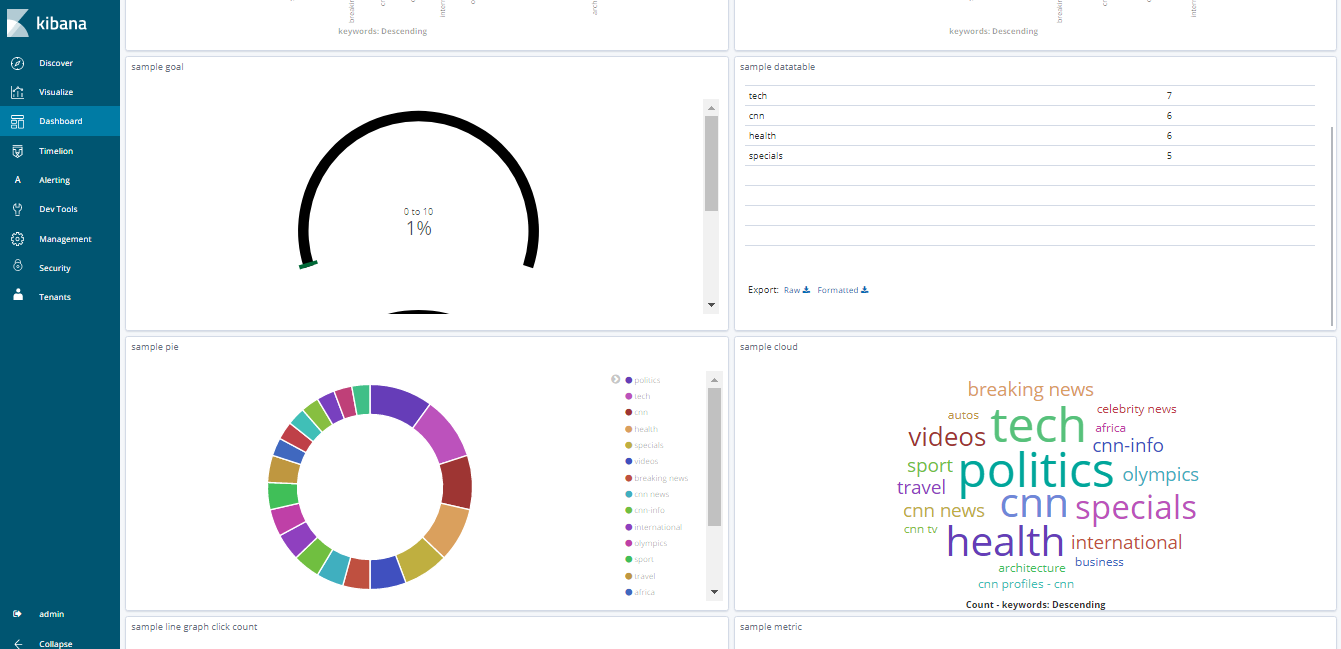
You can also save searches and display them along with visualisations in the dashboard as shown here.
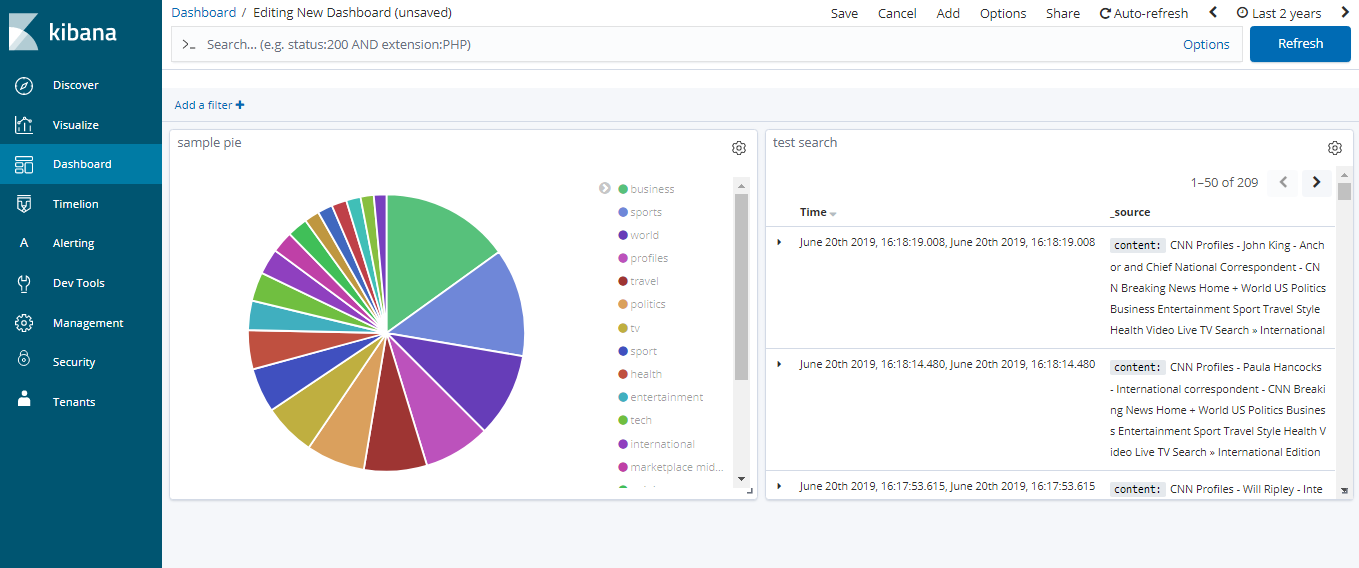
Searching from Kibana
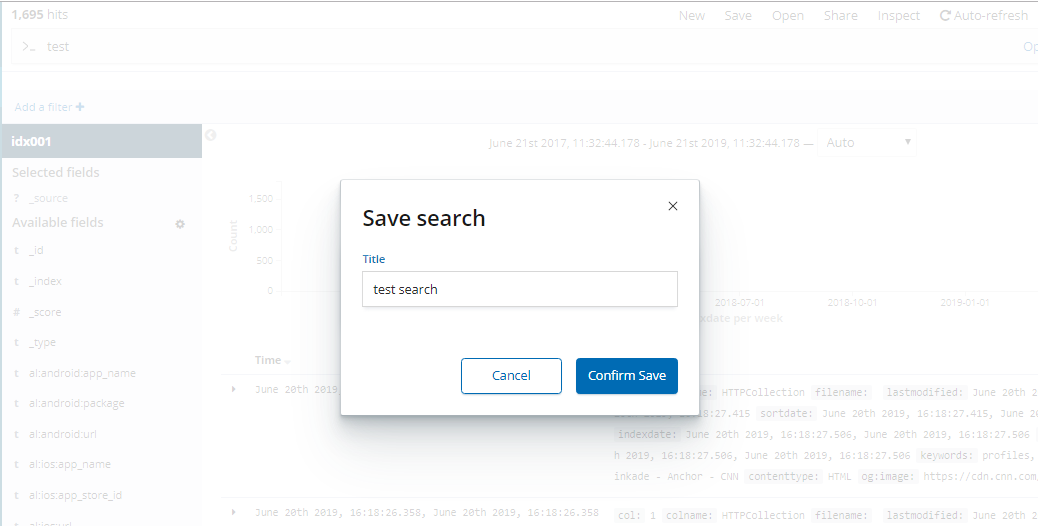
You can search from Kibana by going to menu -> Discover. You can search at various levels and fields in Discover mode.
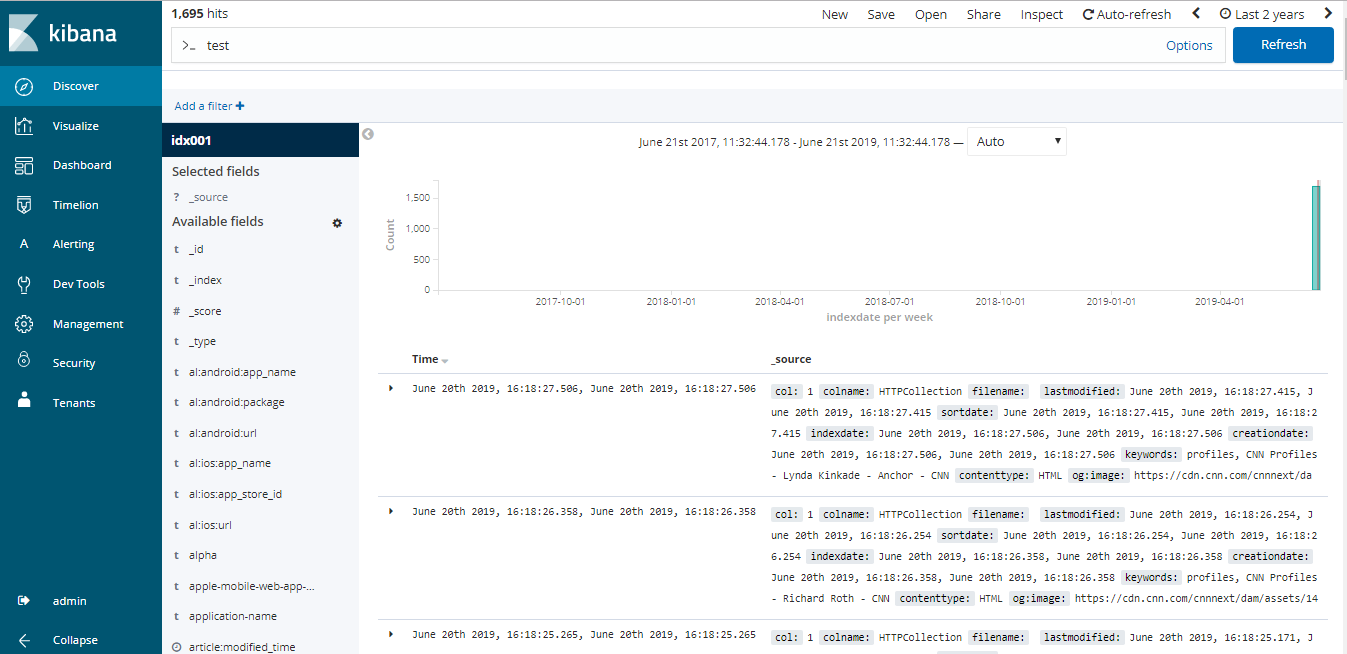
You can save the search and use it in dashboard
More About Kibana
Click the following link to get to know about creating Alerts in Kibana
Kibana Alerts
Click the following link to get to know how to access elasticsearch using Kibana
Access Elasticsearch using Kibana
Please note that you will be able to use Kibana only with a paid server license.
Updated over 4 years ago
